
Market Update January 2025
The Wholesale Electricity Market
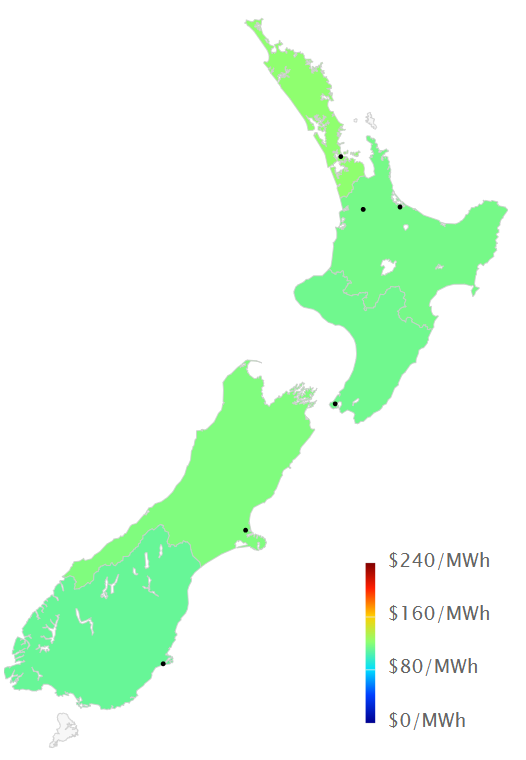
Spot prices in the wholesale electricity market for January increased significantly from December’s very low levels. Average spot prices for the month ranged from $110 in the lower South Island (up from $20 in December) to $122 in the upper North Island ($35 last month).
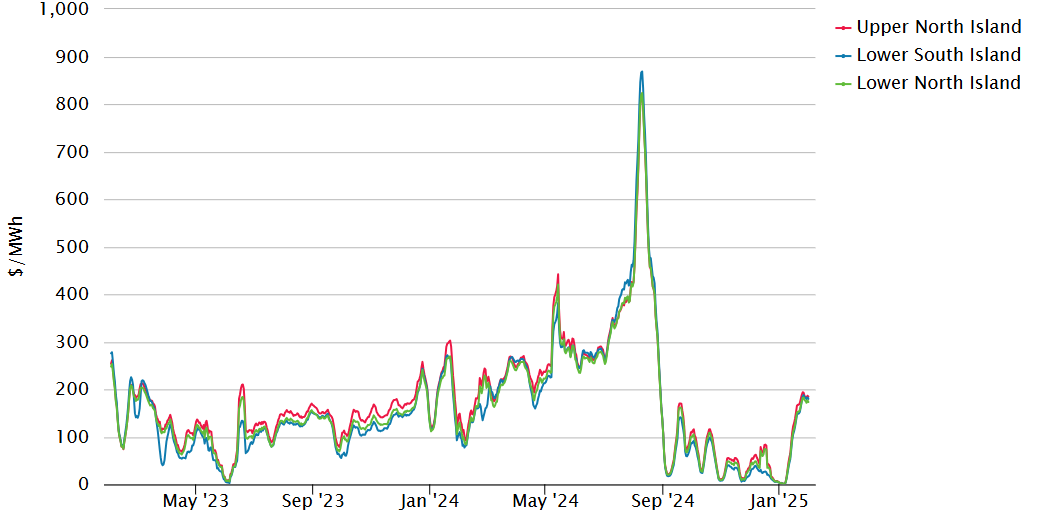
The following chart shows average weekly spot prices over the last two years. The recent large increase can clearly be seen.
Electricity Demand
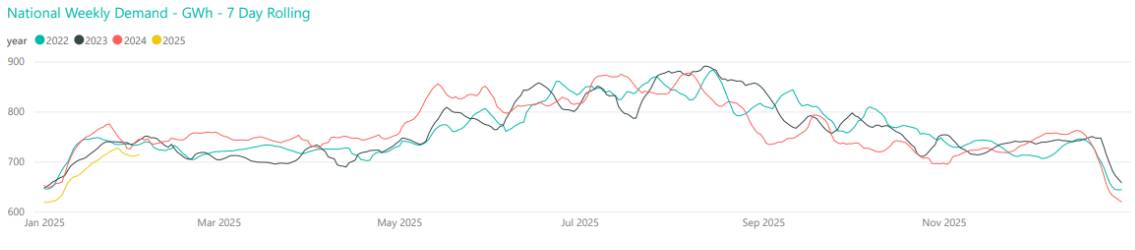
Electricity demand in January was lower than what we have seen in recent years, as shown below.
Electricity Generation Mix
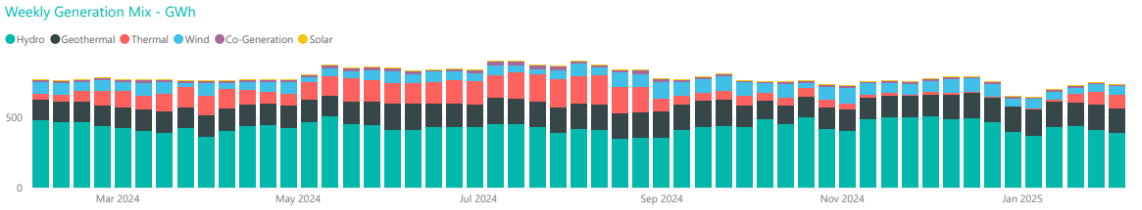
Through January, as demand picked up and hydro inflows dropped off, there was an increase in thermal generation in the second half of the month.
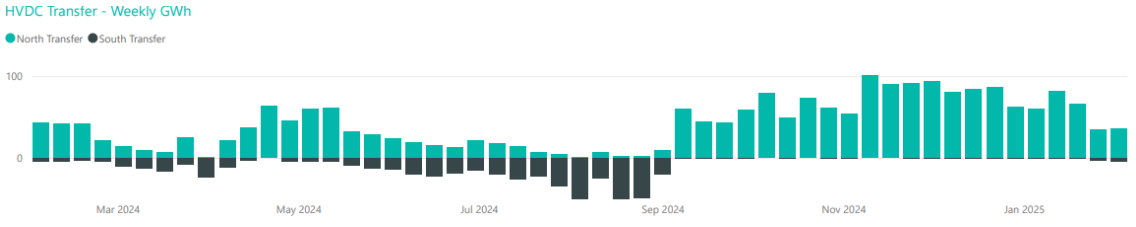
HVDC Transfer
Power transfers on the HVDC link connecting the North and South Islands are important both in showing relative hydro positions and the reliance on thermal power to meet demand. High northward flow tends to indicate a good SI hydro position, whereas the reverse indicates a heavy reliance on thermal power to make up for hydro shortages.
With declining South Island hydro storage levels, January saw a decline in northward transfer and even some southward transfer at the end of the month.
The Electricity Futures Market
The Futures Market indicates where market participants see the spot market moving in the future. They are based on actual trades between participants looking to hedge their positions (as both buyers and sellers) into the future against potential spot market volatility. They are also a useful proxy for the direction of retail contracts.
The following graph shows Futures pricing for CY 2025, 2026, 2027 and 2028 at Otahuhu (Auckland) for the last two years.
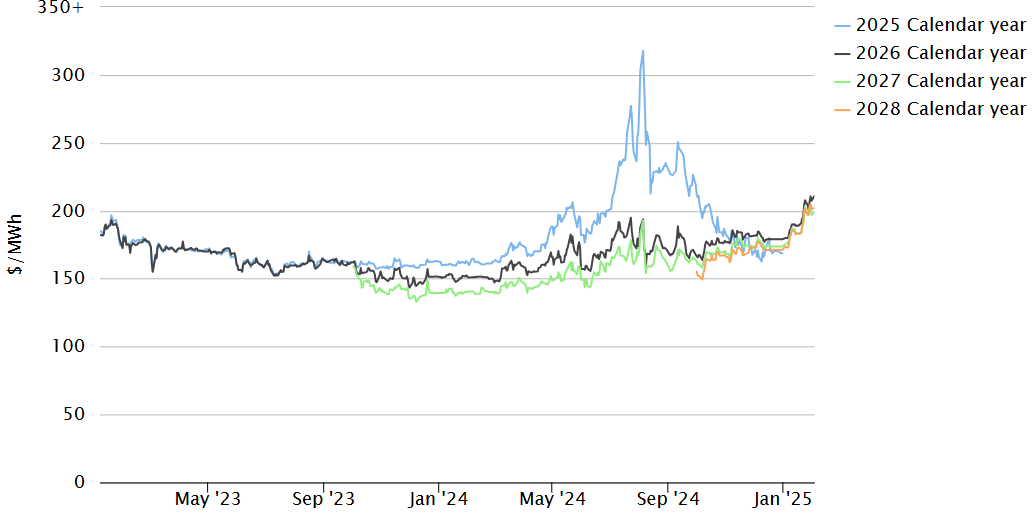
Note that $100/MWh equates to 10c/kWh.
Forward prices had big increases for all years through January. CAL 2026 ended the month at $207 – up 16% over the month. CY 2027 price was up 13% at $197 while CY 2028 was up 17.5% at $201/MWh.
Known new generation projects are shown below (additions/removals/changes highlighted in bold).

Hydro Storage
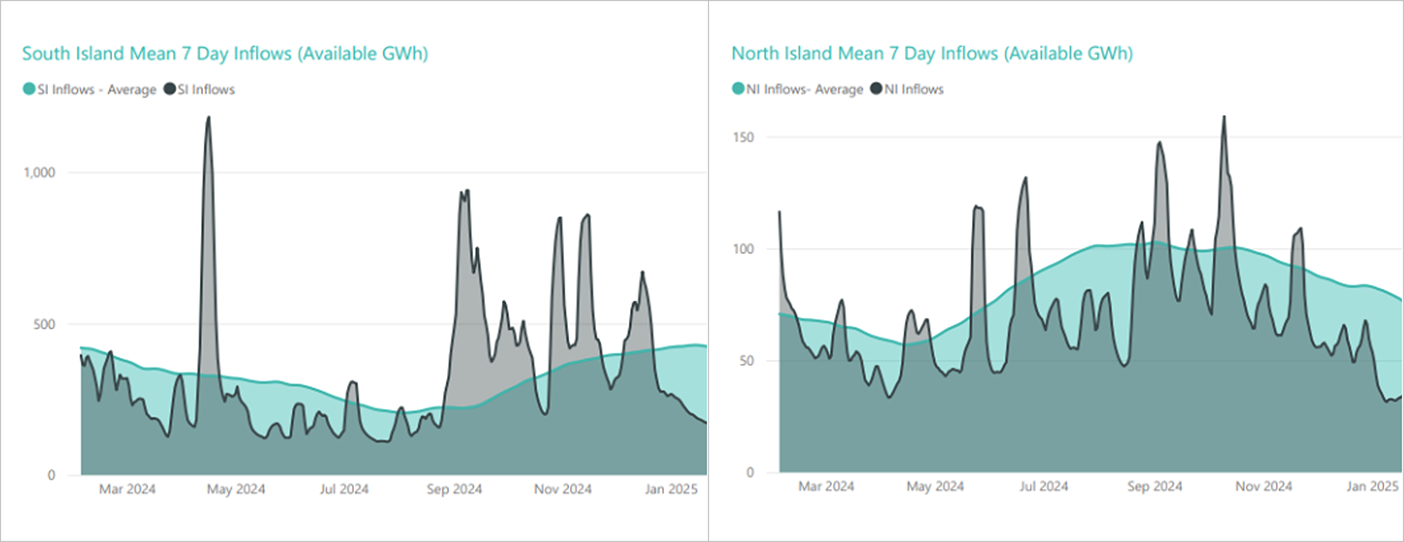
Inflows in both the North and South Islands were well below average in January.
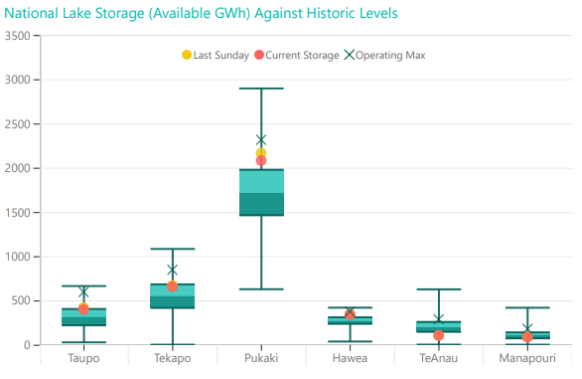
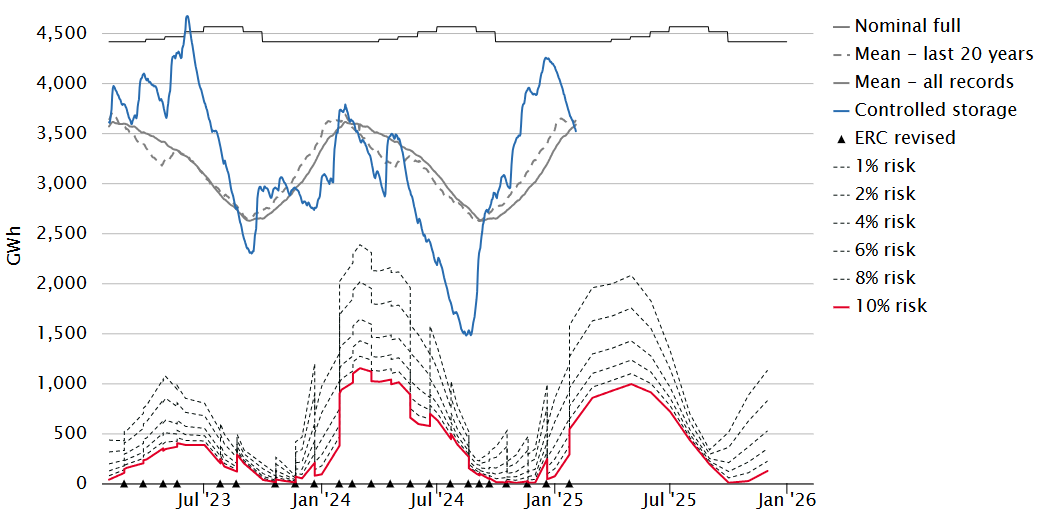
These low inflows resulted in energy storage levels falling through the month to end at 3,605GWh (82% full). Storage is now close to the average level seen at this time of year. The following chart shows the latest breakdown of storage across the main hydro catchments.
Security of supply risks increased through January with storage levels decreasing as shown below.
Snowpack
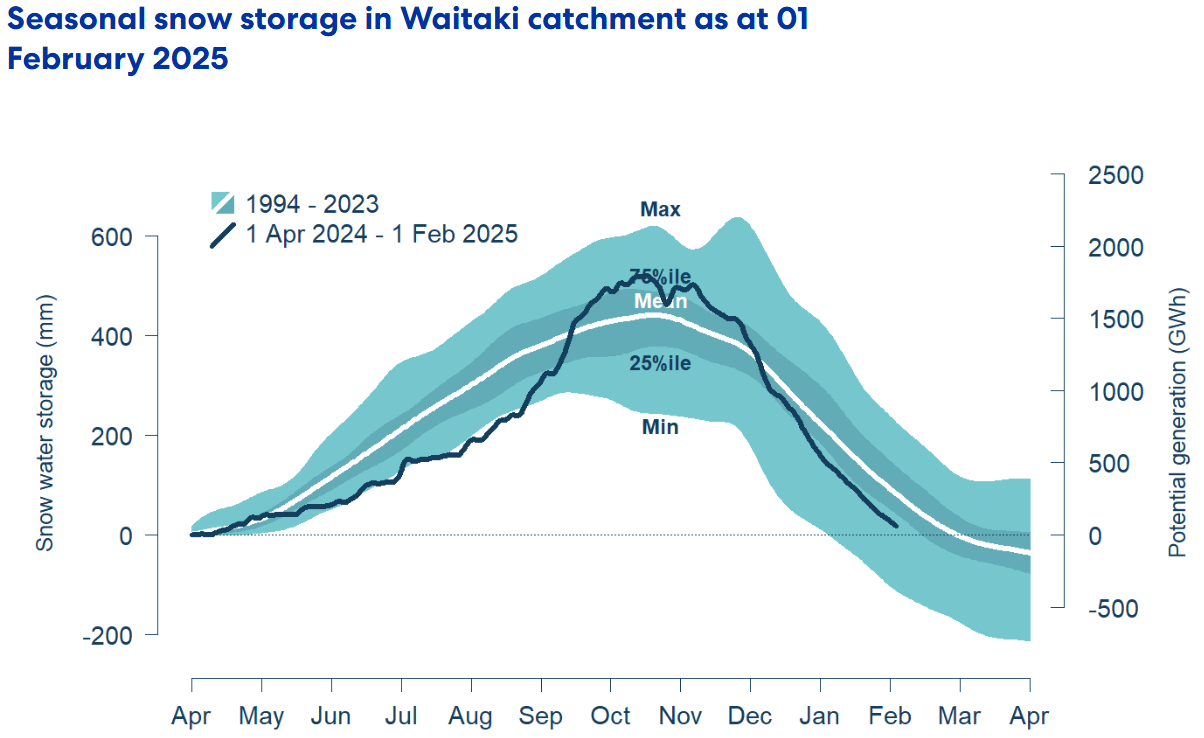
Snowpack is an important way that hydro energy is stored over the winter months and released as hydro inflows in the spring. The following graph shows that the snowpack in the important Waitaki catchment decreased through January and it is currently below the 25th percentile levels seen in the last 30 years for this time of year.
Climate Outlook Overview (from the MetService)
Climate Drivers — El Niño-Southern Oscillation (ENSO) sea surface temperatures have now reached weak La Niña thresholds, but atmospheric conditions have not yet responded. So, whilst we may start to see a more La Niña-like flavour to the weather maps in the next month or two (more northerly lows and warm humid flows), localised climate drivers and potential tropical activity will still play a key role in upcoming New Zealand weather.
The Southern Annular Mode (SAM) and Tasman Sea Index (TSI) tend negative by mid-month, with a change from fine weather under high pressure to more active weather systems across both the North and South Islands, though are likely to trend closer to normal (a mix of fronts and quiet spells) by the end of the month.
Sea surface temperatures are expected to rebound across the country which would add fuel and strength to any incoming weather systems. This includes lows originating in the tropics, which have an increased risk of developing as we progress through February and can deliver boom-or-bust rainfall events, along with bouts of warmth and humidity. While it remains too early to pick any specifics, the highest risk of any tropical influence is from the second into the third week of February, so keep a keen eye northward during this time.
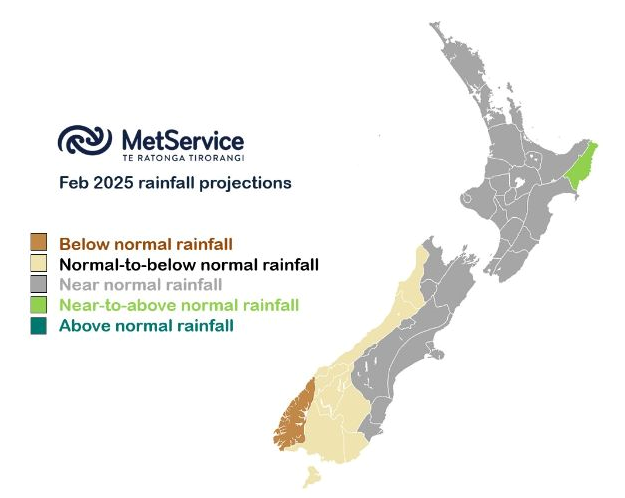
February 2025 Outlook — The month commences with a very conventional summer-time weather pattern, with slow-moving high pressure bringing largely dry conditions across the country, particularly across the western South Island. While periodic fronts will attempt to sweep across the country, high pressure is likely to minimise impacts, leading to increasing soil moisture deficits across most regions. Temperatures are occasionally on the chilly side across some eastern areas in a lingering southerly flow.
Next week sees potential for this dry pattern to persist, though it may come under threat from any systems exiting the tropics. While it only takes one boom-or-bust rain deluge to push weekly rainfall totals notably wetter, any system could just as easily pass peacefully to the northeast with minimal concerns.
The start of week three sees a continued risk for tropical influence, but the weather is expected to trend more seasonal by the end, with a mix of dry highs and quick-moving lows. Temperatures are likely to fluctuate with these features, but overall trend close to normal.
The final week of February sees quite seasonable weather, with the usual sequence of high pressure interrupted by brief weathermakers, and the month may end on a rather average note.
The Wholesale Gas Market
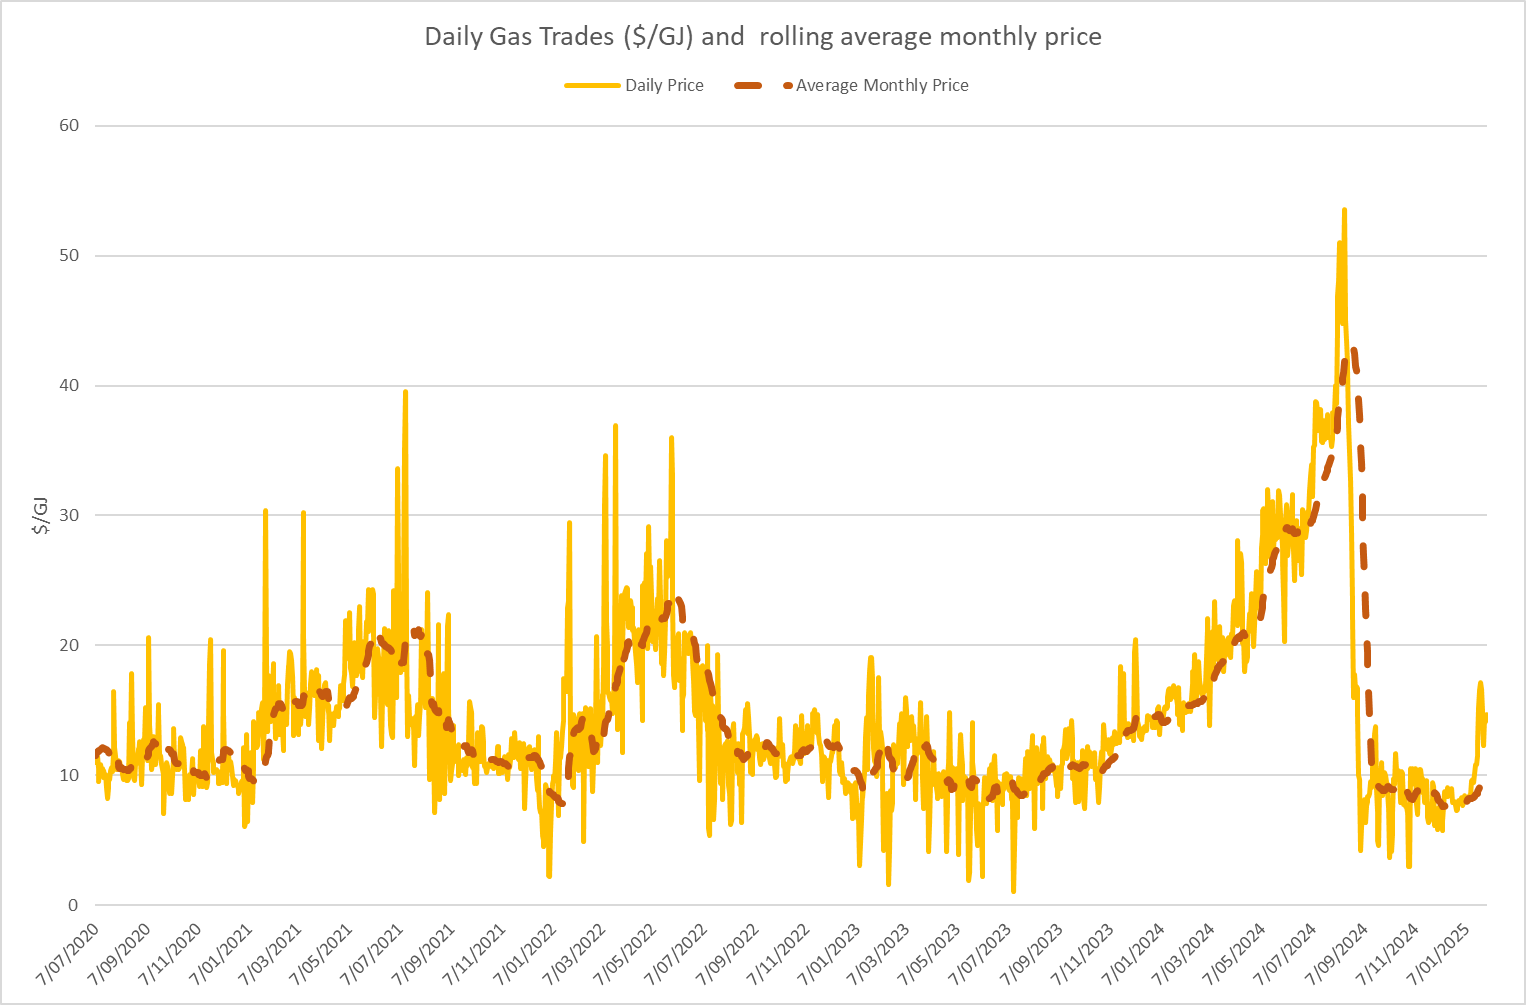
Spot gas prices in January climbed gradually at the start of the month before jumping up from the middle of the month on. Prices for the month averaged $10.75/GJ – a 39% increase compared to December. Average prices were 29% lower than they were at the same time last year.
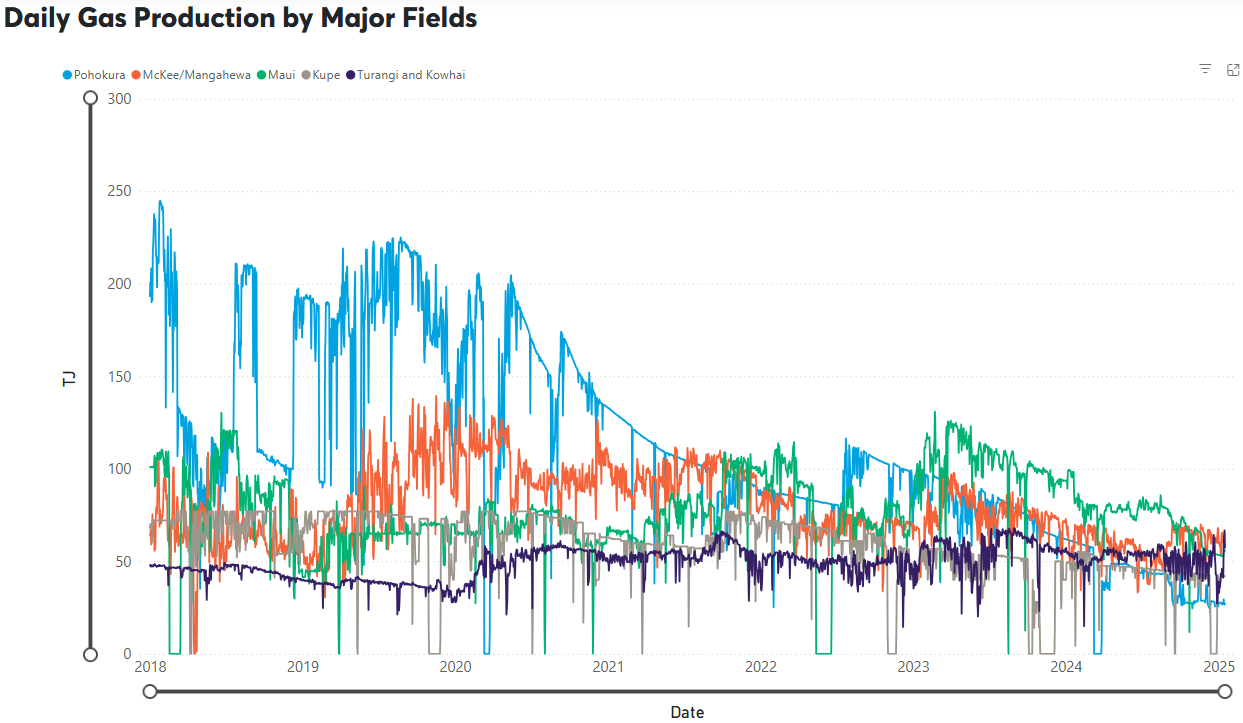
On the supply side, most fields maintained output through January or fell slightly. The exception was Turangi and Kowhai which increased from around 35TJ/day at the start of the month, to around 64TJ/day later in the month. Maui production reduced slightly over the month falling to 53TJ/day. Pohokura maintained output, averaging around 28TJ/day. Kupe also held its output at around 42TJ/day. McKee/Mangahewa maintained its output at 61TJ/day.
The following graph shows production levels from major fields over the last seven years.
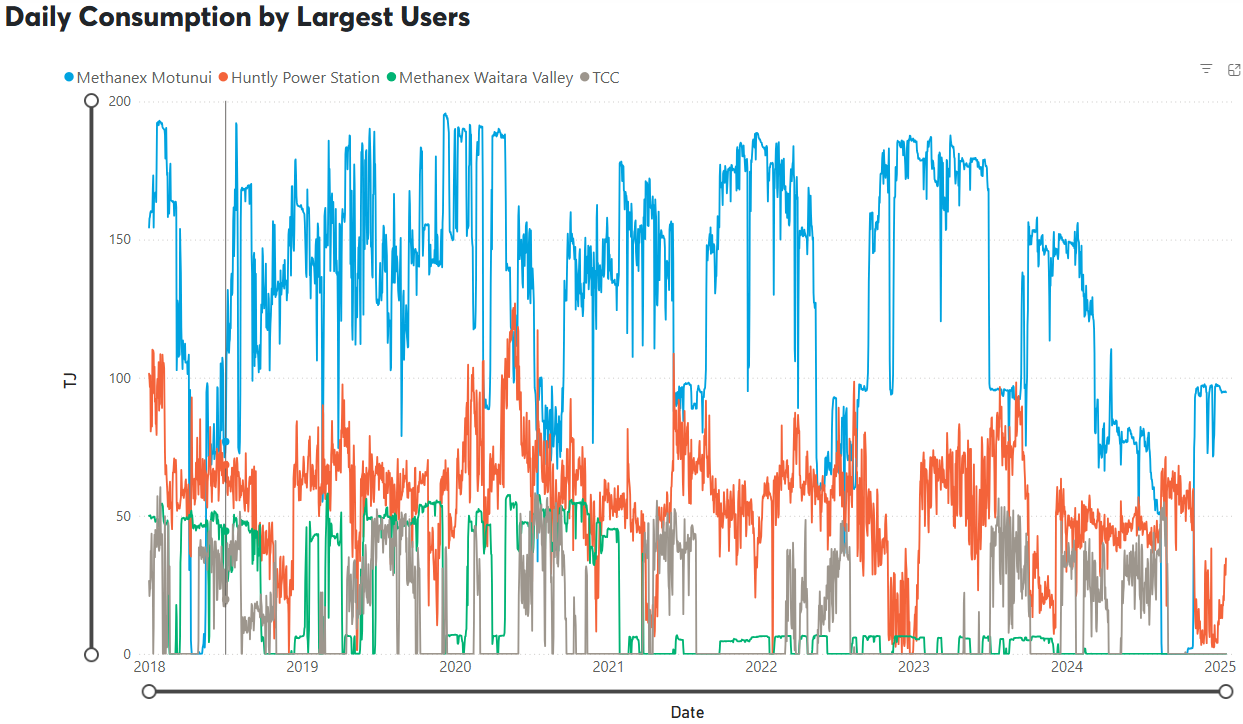
Through much of January, Methanex used close to 95TJ/day but fell closer to 85TJ/day towards the end of the month. Huntly usage increased markedly – from 17TJ/day at the start of the month up to more than 50TJ/day at the end. TCC remained idle for the month and Contact Energy has advised that it has no gas contracted to enable TCC to run. There is talk that Genesis has swapped some contracted gas with Methanex, “banking” some gas if required for this winter.
The following graph shows trends in the major gas users over the last six years.
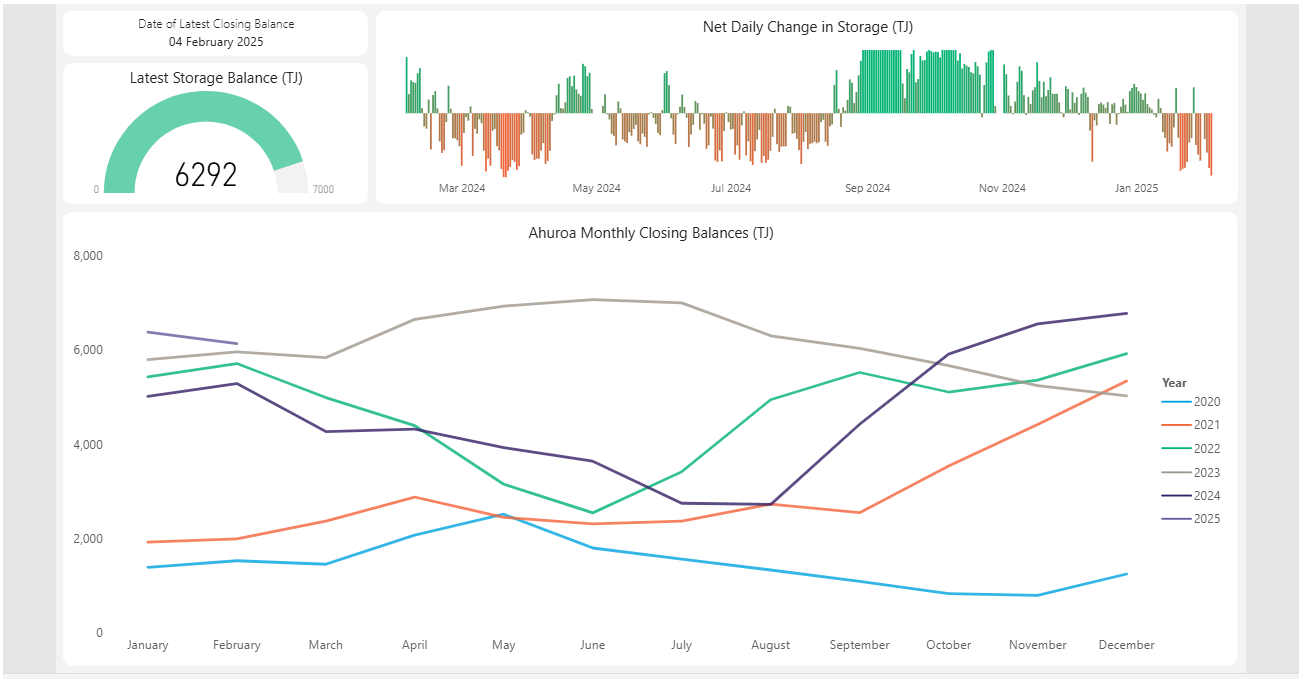
Gas storage is becoming increasingly important as falling production coincides with more variable demand, particularly from gas-fired electricity generation. The following chart shows how storage at Ahuroa decreased through January but it remains at the highest level it has been at this time of year over the last few years.
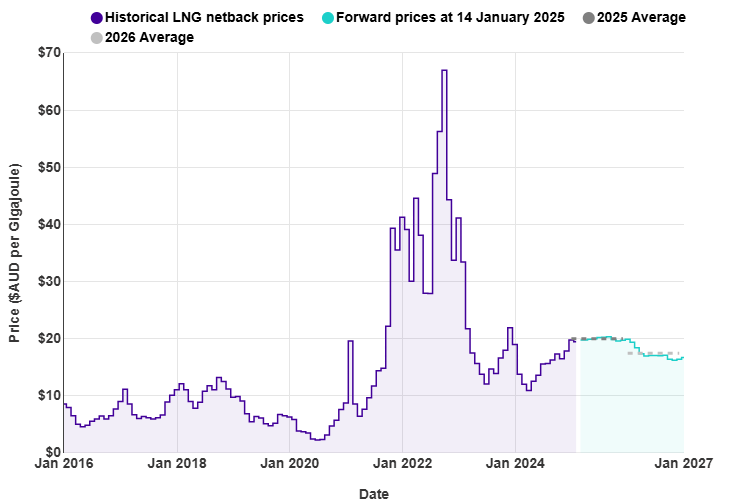
Internationally, LNG netback prices ended the month at $19.46/GJ – down 1.5% from last month. Forecast prices for 2025 were down 2% at $19.98/GJ. Forward prices for 2026 were flat at $17.44/GJ. (Note that netback prices are indicative of international prices – they are produced by the ACCC and quoted in Australian dollars. They are net of the estimated costs to convert from pipeline gas in Australia to LNG, hence the term “netback”).
New Zealand does not (yet) have an LNG export/import market, so our domestic prices are not directly linked to global prices. With recent gas supply issues, the Government is now talking about the possibility of facilitating the building of an LNG import facility.
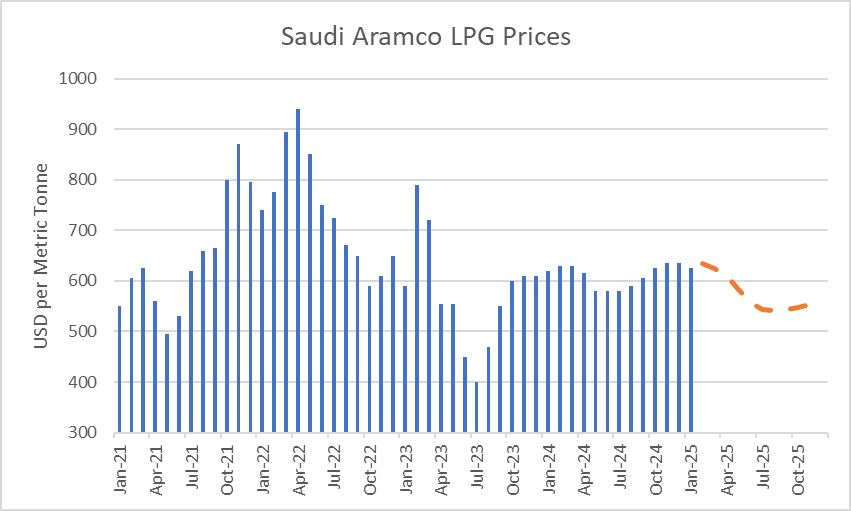
LPG is an important fuel for many large energy users, particularly in areas where reticulated natural gas is not available. The contract price of LPG is typically set by international benchmarks such as the Saudi Aramco LPG – normally quoted in US$ per metric tonne.
The following graph shows the Saudi Aramco LPG pricing for the last four years as well as forecast pricing for the year ahead. Futures pricing increased again over the last month.
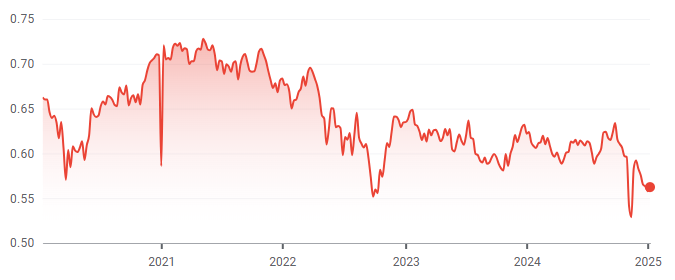
The other main contributing factor to LPG prices in New Zealand is the exchange rate against the USD. The exchange rate was volatile in January ending the month near where it began – just above 0.56, near the lowest levels seen in recent years. This would tend to push up LPG prices when quoted in NZD.
The Coal Market
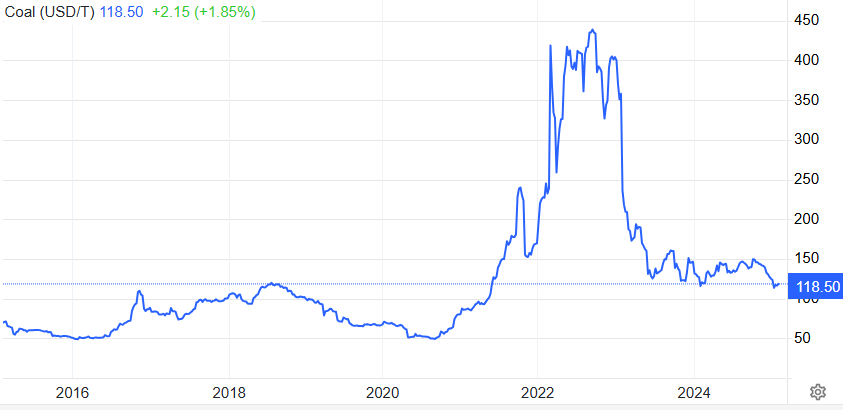
The global energy crisis has been as much about coal as it has gas. The war in the Ukraine has driven energy prices, including coal, higher. Prices in January fell, ending the month at US$118.5/T – a 5% decrease on the December close. These prices are finally returning to levels close to what we expect to see, as shown in the following graph of prices over the last 10 years.
Like gas, the price of coal can flow through and have an impact on the electricity market. In October Genesis reported that it planned to import at least 270,000 tonnes of coal by March to help secure electricity supplies going into next winter. It had previously aimed to stockpile 350,000 tonnes, but now says it wants to hold about 500,000 tonnes to cover peak autumn and winter electricity demand in 2025. Genesis says that 500,000 tonnes is the equivalent of about 1,000GWh of electricity storage or 22% of maximum hydro storage in New Zealand.
Carbon Pricing
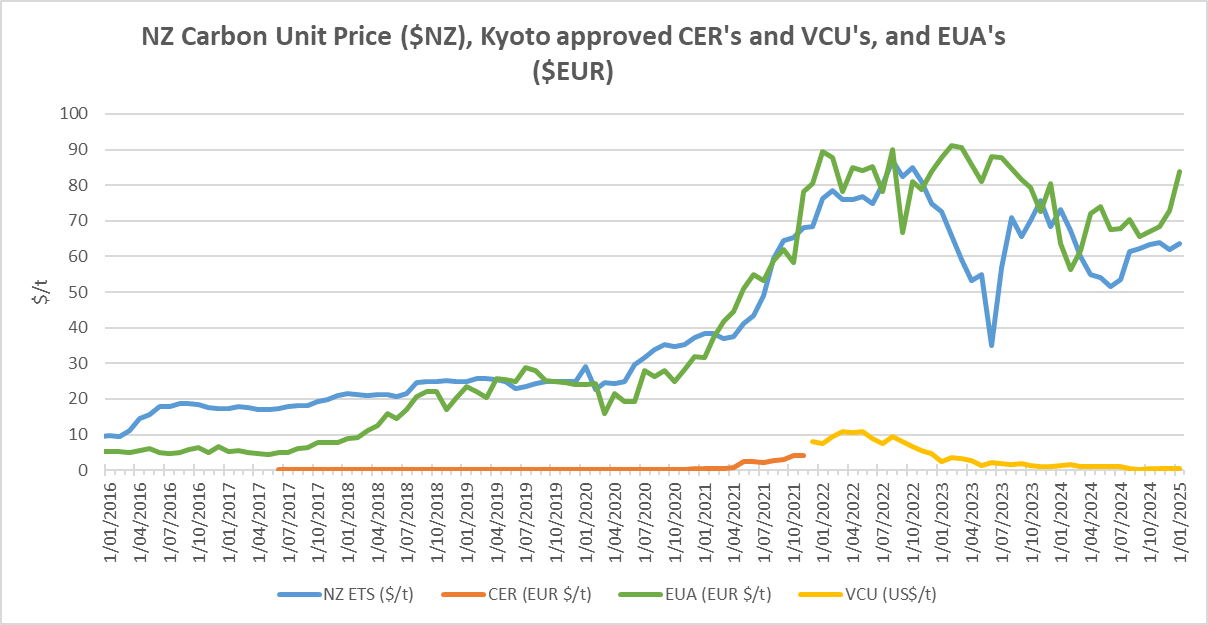
New Zealand has had an Emissions Trading Scheme (ETS) in place since 2008. It has been subsequently reviewed by several governments and is now an “uncapped” price scheme closely linked to international schemes. However, there are “upper and lower guard rails” set up to prevent wild swings in carbon price that act as minimum and maximum prices. These increased in December 2023 to $173 and $64 respectively. Carbon prices increased 3% in January to $63.7.
As the carbon price rises, the cost of coal, gas or other fossil fuels used in process heat applications will naturally also rise. Electricity prices are also affected by a rising carbon price. Electricity prices are set by the marginal producing unit – in NZ this is currently, typically coal, gas or hydro generators, with the latter valuing the cost of its water against the former. An increase in carbon prices can lead to an increase in electricity prices in the short to medium term (as the marginal units set the price). A carbon price of $50/t is estimated to currently add about $25/MWh (or ~2.5c/kWh) to electricity prices. In the long term, the impact should reduce as money is invested in more low-cost renewables and there is less reliance on gas and coal-fired generation.
EU Carbon units increased in January to 84 Euro/tonne – up 15%.
About this Report:
This energy market summary report provides information on wholesale price trends within the NZ Electricity Market.
Please note that all electricity prices are presented as a $ per MWh price and all carbon prices as a $ per unit price.
All spot prices are published by the Electricity Authority. Futures contract prices are sourced from ASX.
Further information can be found at the locations noted below.
- Transpower publishes a range of detailed information which can be found here: https://www.transpower.co.nz/power-system-live-data
- The Electricity Authority publishes a range of detailed information which can be found here: https://www.emi.ea.govt.nz/
- Weather and Climate data – The MetService publishes a range of weather-related information which can be found here: https://www.metservice.com/
Disclaimer: This document has been prepared for information and explanatory purposes only and is not intended to be relied upon by any person. This document does not form part of any existing or future contract or agreement between us. We make no representation, assurance, or guarantee as to the accuracy of the information provided. To the maximum extent permitted by law, none of Smart Power Ltd, its related companies, directors, employees or agents accepts any liability for any loss arising from the use of this document or its contents or otherwise arising out or, or in connection with it. You must not provide this document or any information contained in it to any third party without our prior consent.
About Smart Power:
Smart Power is a full-service Energy Management consultancy. Apart from Energy Procurement, Smart Power can also provide:
- Technical advice on how to reduce your energy use & emissions
- Sustainability Reporting
- Invoice Management Services
We also offer boutique energy and water billing services for landlords/property developers.
Contact us here or call one of our offices to talk to our experienced staff about how we can assist you with achieving your energy goals.
© Copyright, 2025. Smart Power Ltd