
The Wholesale Electricity Market
After record highs through August, spot prices in the wholesale electricity market for September continued at the much lower levels seen at the end of last month. Average spot prices for the month ranged from $69 in the lower South Island (down from $488 in August), up to $80 in the upper North Island (down from $457).

The following chart shows average weekly spot prices over the last 2 years. The extreme highs and lows over the last two months can be clearly seen.

Electricity Demand
Electricity demand through September was low compared to the last few years with mild early spring weather in most parts of the country.

Electricity Generation Mix
Through September, reduced demand and increased wind generation, along with increased hydro generation meant that thermal generation could back off.

HVDC Transfer
Power transfers on the HVDC link connecting the North and South Islands are important both in showing relative hydro positions and the reliance on thermal power to meet demand. High northward flow tends to indicate a good SI hydro position, whereas the reverse indicates a heavy reliance on thermal power to make up for hydro shortages.
With plenty of uncontrolled inflows and increasing hydro storage levels, September saw more “normal” northward transfers return and very little southward transfer for the month.

The Electricity Futures Market
The Futures Market provides an indication of where market participants see the spot market moving in the future. They are based on actual trades between participants looking to hedge their positions (as both buyers and sellers) into the future against potential spot market volatility. They are also a useful proxy for the direction of retail contracts.
The following graph shows Futures pricing for CY 2024, 2025, 2026 and 2027 at Otahuhu (Auckland) for the last 2 years.

Note that $100/MWh equates to 10c/kWh.
Forward prices climbed at the start of September particularly for CAL 2025, which peaked at $250/MWh before falling. CAL 2025 ended the month at $219 – down 6%. CY 2026 price was down 2% at $168 while CY 2027 closed up 1% at $164/MWh.
Known new generation projects are shown below (additions / removals / changes highlighted in bold).

Hydro Storage
Inflows in the South Island approached record levels in many hydro catchments. Te Anau / Manapouri went from minimum levels to close to the highest levels seen, at this time of year, in a matter of days. The lower Waiau river which takes over-flow or spill from Manapouri was consistently flowing more than 600cumecs (and as high as 800cumecs) for much of September. Putting this in perspective the Waikato river at the Huka Falls typically flows between 50 – 250cumecs.
The North Island was comparatively tame with a little more than average inflows for the month.

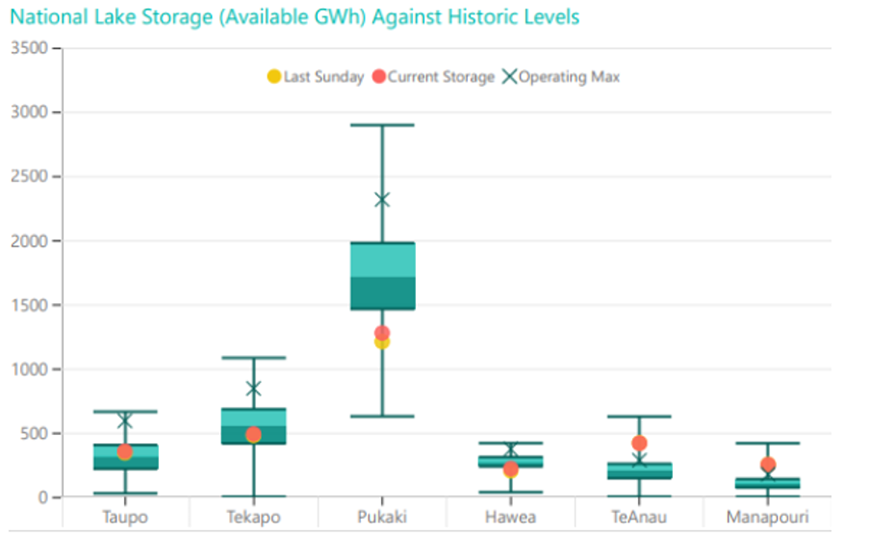
These very high inflows resulted in energy storage levels climbing throughout September reaching 2,882 (65% full) at the end of the month – an increase of 968GWh over the month. Storage is now back above the average level seen at this time of year. The following chart shows the latest breakdown of storage across the main hydro catchments.
Security of supply risks decreased throughout September with storage levels increasing. This is shown in the following risk curves.

Snowpack
Snowpack is an important way that hydro energy is stored over the winter months and released as hydro inflows in the spring. The following graph shows that the snowpack in the important Waitaki catchment increased through September with some good dumps of snow and is now above the 75th percentile levels seen in the last 30 years for this time of year.

Climate outlook overview (from the MetService)
Climate drivers — El Niño Southern Oscillation (ENSO) remains in neutral territory. Longer-range climate models continue to pick a near-even chance of either remaining neutral, or a weak La Niña developing over the next few months. In either case, any weather impacts from ENSO are not expected before summer.
The Southern Annular Mode (SAM) was strongly negative last month, resulting in frequent fronts and lows passing over the South Island. This should remain negative over the next week with further weather systems in the south, but is likely to trend neutral or even positive from the middle of October as high pressure builds across the Far South and Southern Ocean, with less frequent rain-makers for the South Island. A pulse of Madden-Julian Oscillation (MJO) is picked to move into the Southwest Pacific mid-late month, and this could enhance the risk for moisture-laden air masses to spread northerly rain across the top half of New Zealand.
October 2024 Outlook — A slow-moving low affects New Zealand through the first week of October, bringing heavy rain and thunderstorms across much of the country, and a risk for late season snow about the Otago high country farms. Another low brings a second burst of rainfall and strong westerly winds to much of the country over the weekend and into early next week. This brings warming temperatures across the North Island, but a possible cold snap in the south with frosts becoming likely from the middle of next week.
This pattern shifts around mid-October. While models famously struggle during the Southern Hemisphere spring (called the springtime predictability barrier), all indications are for more frequent and stronger high pressure systems spreading across the Southern Ocean and over the South Island. This will help push any low pressure systems further north over the Tasman Sea and North Island, and the South Island is likely to see the majority of its October rainfall during the first 1-2 weeks of the month as activity moves northwards, with a temporary reprieve from wetter conditions. However, the risk for morning frosts increases during the final two weeks of October across the South Island, with temperatures falling near or slightly below normal.
It’s a different story for the North Island, where the risk for heavy northerly rainfall events increases during the back half of the month. Passing high pressure systems are still expected, but Tasman lows become more likely during this time, and the MJO passage may enhance the moisture content of any approaching lows. Northern regions from Northland and Auckland, to Bay of Plenty and Gisborne have a greater chance of seeing these heavy rainfall events, but it’s important to remember these may be boom-or-bust events.
Springtime is a period of highly changeable weather across New Zealand, so we can expect this volatile weather pattern to continue into next month.

The Wholesale Gas Market
Spot gas prices in September continued at the very low levels seen at the very end of August. Prices for the month averaged $8.8/GJ – a 77% decrease compared to August. Average prices are now 17% lower than they were at the same time last year.

On the supply side Maui produced 70TJ/day – down 11%. Pohokura dropped output significantly at around 33TJ/day – down 35%. McKee / Mangahewa increased its production, up 25% at 64TJ/day. Kupe maintained around 45TJ/day apart from a short outage in the middle of the month.
The following graph shows production levels from major fields over the last 6 years.

As noted last month Methanex did a deal with the large electricity generators to shut down its Motunui site in the middle of August through to the end of October. Gas usage was zero for the whole of September. Huntly usage was constant at close to the 60TJ/day observed at the end of last month, while TCC was shut down for all the month.
The following graph shows trends in the major gas users over the last 6 years.

Internationally, LNG netback prices ended the month up at $17.34/GJ – up 6.5% from last month. Forecast prices for 2024 increased to $15.04 – down 2% compared to July. Forecast prices for 2025 were down 6.5% at $16.81/GJ. (Note that netback prices are indicative of international prices – they are produced by the ACCC and quoted in Australian dollars. They are net of the estimated costs to convert from pipeline gas in Australia to LNG, hence the term “netback”)

New Zealand does not (yet) have an LNG export/import market, so our domestic prices are not directly linked to global prices. With recent gas supply issues, the Government is now talking about the possibility of facilitating the building of an LNG import facility.
LPG is an important fuel for many large energy users, particularly in areas where reticulated natural gas is not available. The contract price of LPG is typically set by international benchmarks such as the Saudi Aramco LPG – normally quoted in US$ per metric tonne.
The following graph shows the Saudi Aramco LPG pricing for the last 3 years as well as forecast pricing for the year ahead. There has been an increase in futures pricing over the last month.

The other main contributing factor to LPG prices in New Zealand is the exchange rate against the USD. While volatile during the month the exchange rate ended the month at about the same level that it started it.

The Coal Market
The global energy crisis has been as much about coal as it has gas. The war in the Ukraine has driven energy prices, including coal, up. Prices in September were largely flat, ending the month at US$145/T – a 1% increase on the August close. These prices are finally returning to levels close to what we expect to see as shown in the following graph of prices over the last 10 years.

Like gas, the price of coal can flow through and have an impact on the electricity market. In August Genesis reported that it had imported additional coal. Stockpiles had reduced to 231,000 tonnes at the end of June – down from 624,000 tonnes at the end of March. Genesis says that it usually aims to hold about 350,000 tonnes of coal.
Carbon Pricing
NZ has had an Emissions Trading Scheme (ETS) in place since 2008. It has been subsequently reviewed by several governments and is now an “uncapped” price scheme closely linked to international schemes. However, there are “upper and lower guard rails” set up to prevent wild swings in carbon price that act as minimum and maximum prices. These increased in December 2023 to $173 and $64 respectively. Carbon prices increased 1% in September to $62.2.

As the carbon price rises, the cost of coal, gas or other fossil fuels used in process heat applications will naturally also rise. Electricity prices are also affected by a rising carbon price. Electricity prices are set by the marginal producing unit – in NZ this is currently typically coal or gas or hydro generators, with the latter valuing the cost of its water against the former. An increase in carbon price can lead to an increase in electricity prices in the short to medium term (as the marginal units set the price). A carbon price of $50/t is estimated to currently add about $25/MWh (or ~2.5c/kWh) to electricity prices. In the long term the impact should reduce as money is invested in more low-cost renewables and there is less reliance on gas and coal fired generation.
EU Carbon Permits decreased in September to 65.5 Euro/tonne – down 7%.
About this Report:
This energy market summary report provides information on wholesale price trends within the NZ Electricity Market.
Please note that all electricity prices are presented as a $ per MWh price and all carbon prices as a $ per unit price.
All spot prices are published by the Electricity Authority. Futures contract prices are sourced from ASX.
Further information can be found at the locations noted below.
- Transpower publishes a range of detailed information which can be found here: https://www.transpower.co.nz/power-system-live-data
- The Electricity Authority publishes a range of detailed information which can be found here: https://www.emi.ea.govt.nz/
- Weather and Climate data – The MetService publishes a range of weather-related information which can be found here: https://www.metservice.com/
Disclaimer: This document has been prepared for information and explanatory purposes only and is not intended to be relied upon by any person. This document does not form part of any existing or future contract or agreement between us. We make no representation, assurance, or guarantee as to the accuracy of the information provided. To the maximum extent permitted by law, none of Smart Power Ltd, its related companies, directors, employees or agents accepts any liability for any loss arising from the use of this document or its contents or otherwise arising out or, or in connection with it. You must not provide this document or any information contained in it to any third party without our prior consent.
About Smart Power:
Smart Power is a full-service Energy Management consultancy. Apart from Energy Procurement, Smart Power can also provide:
- Technical advice on how to reduce your energy use & emissions
- Sustainability Reporting
- Invoice Management Services
We also offer boutique energy and water billing services for landlords/property developers.
Contact us here or call one of our offices to talk to our experienced staff about how we can assist you with achieving your energy goals.
© Copyright, 2024. Smart Power Ltd


