
Market Update August 2024
The Wholesale Electricity Market
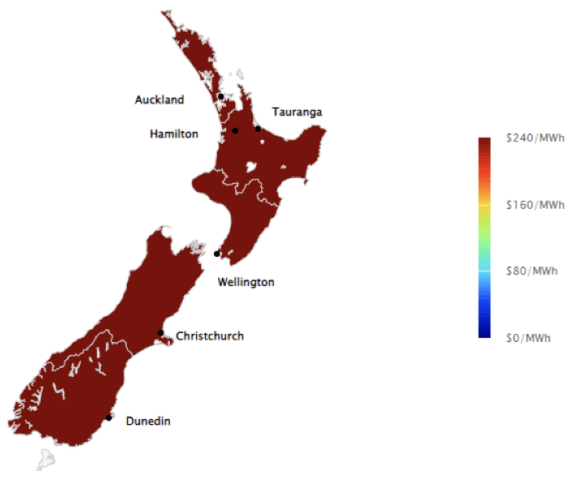
Spot prices in the wholesale electricity market went ballistic at the start of August increasing to close to $900/MWh on a rolling 7-day basis at the start of the month before crashing back to earth at the end of the month. Average spot prices for the month ranged from $429 in the central North Island (up from $338 in July), up to $526 in the upper South Island (up from $414).
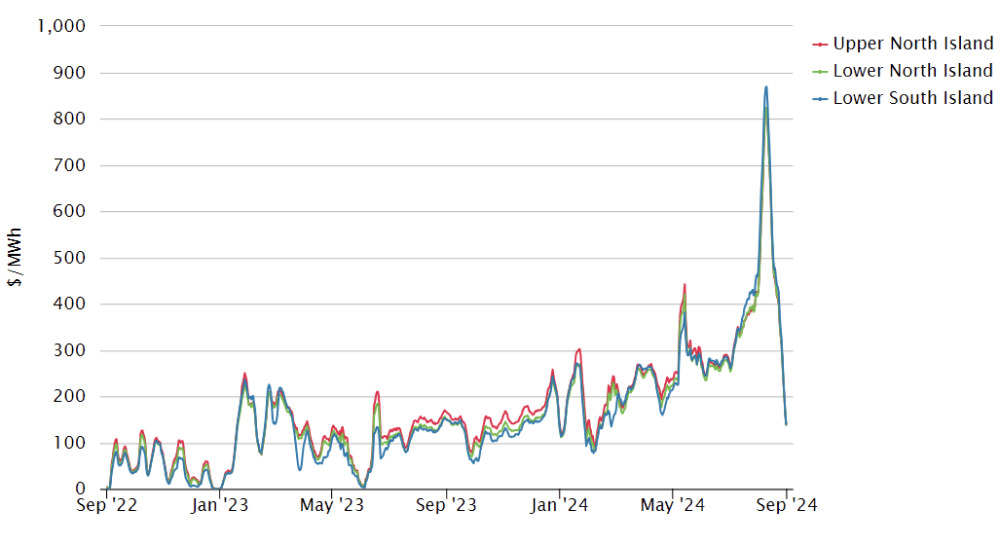
The following chart shows average weekly spot prices over the last 2 years. August’s massive volatility can be clearly seen.
Electricity Demand
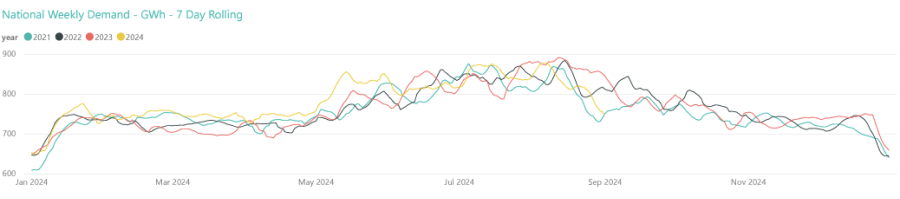
Electricity demand through August was variable with higher levels corresponding to some cold spells, before reducing to unseasonably low levels of demand towards the end of the month. Some large industrials shut down due to the elevated wholesale market which will have pulled overall demand down.
Electricity Generation Mix
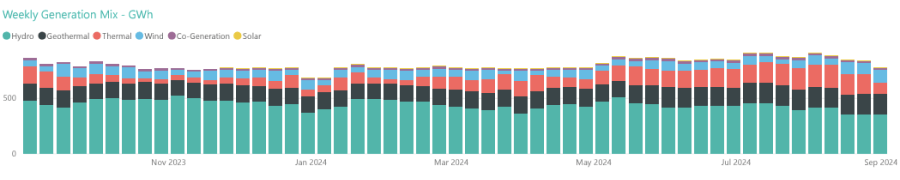
Through August, reduced demand and increased wind generation, along with maximum thermal generation meant that hydro generation was kept to a minimum for the month. Low demand at the end of the month allowed thermal generation to back off.
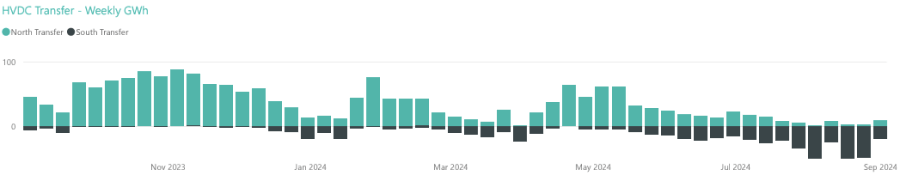
HVDC Transfer
Power transfers on the HVDC link connecting the North and South Islands are important both in showing relative hydro positions and the reliance on thermal power to meet demand. High northward flow tends to indicate a good SI hydro position, whereas the reverse indicates a heavy reliance on thermal power to make up for hydro shortages.
August saw further attempts to conserve South Island storage by reducing northward transfer and increasing southward transfer. Transfers in each week of August were almost exclusively southward – something not seen very often. High uncontrolled inflows in the SI in the last week of the month allowed southward transfer to reduce.
The Electricity Futures Market
The Futures Market provides an indication of where market participants see the spot market moving in the future. They are based on actual trades between participants looking to hedge their positions (as both buyers and sellers) into the future against potential spot market volatility. They are also a useful proxy for the direction of retail contracts.
The following graph shows Futures pricing for CY 2024, 2025, 2026 and 2027 at Otahuhu (Auckland) for the last 2 years.
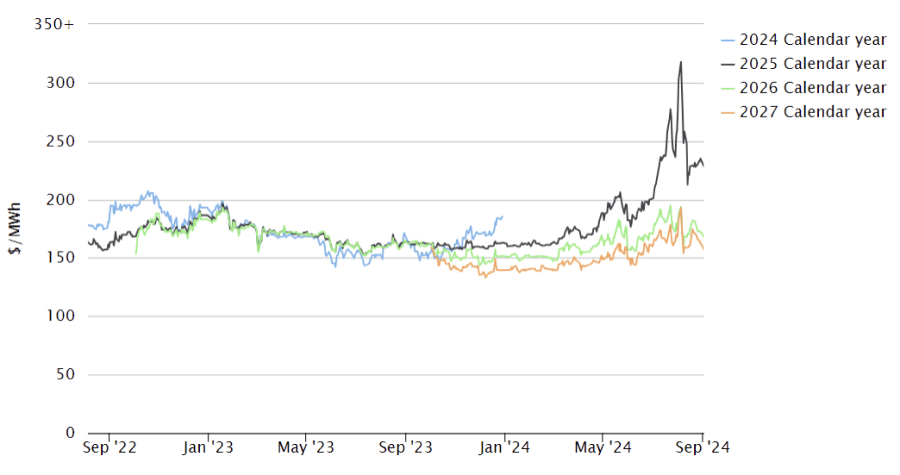
Note that $100/MWh equates to 10c/kWh.
Forward prices climbed at the start of August particularly for CAL 2025, which peaked at $318/MWh on the 5th August, before falling. CAL 2025 ended the month at $233 – down 10%. CY 2026 price was down 2% at $171 while CY 2027 closed down 3% at $162/MWh.
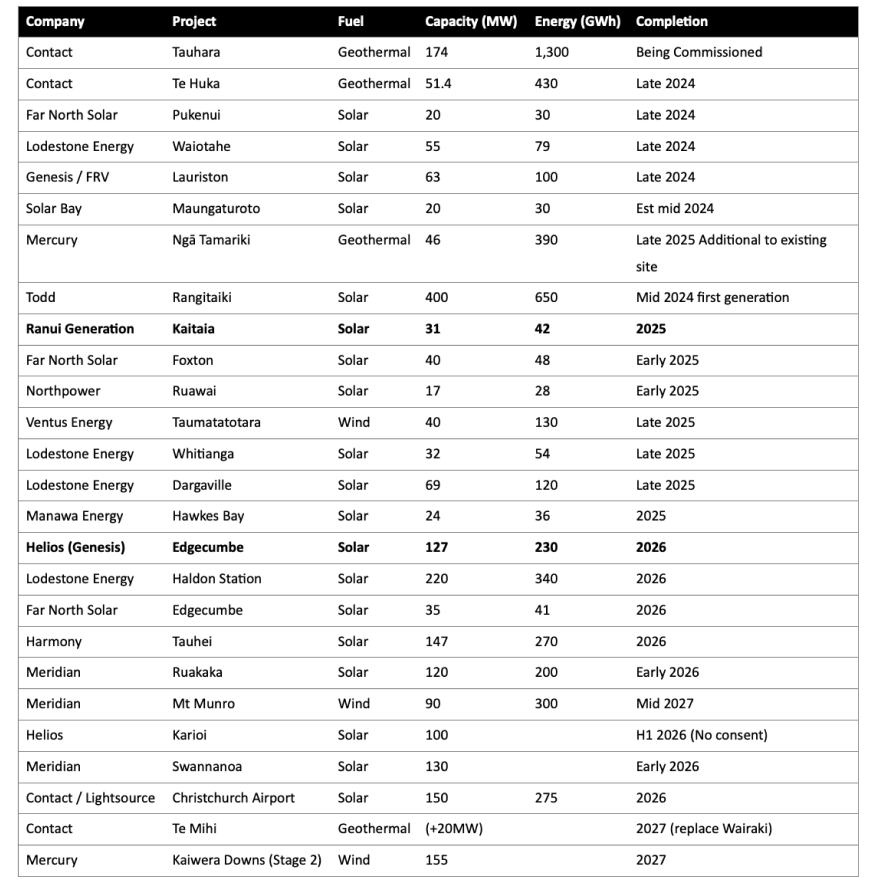
Known new generation projects are shown below (additions / removals / changes highlighted in bold).
Hydro Storage
Inflows remained below average at the start of August, however they picked up, particularly in the SI at the end of the month.
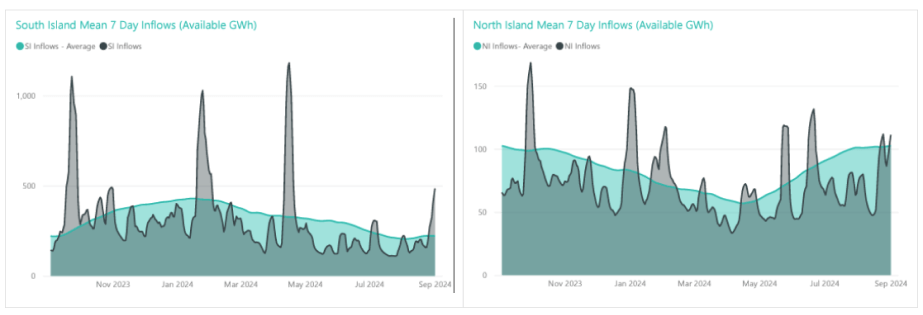
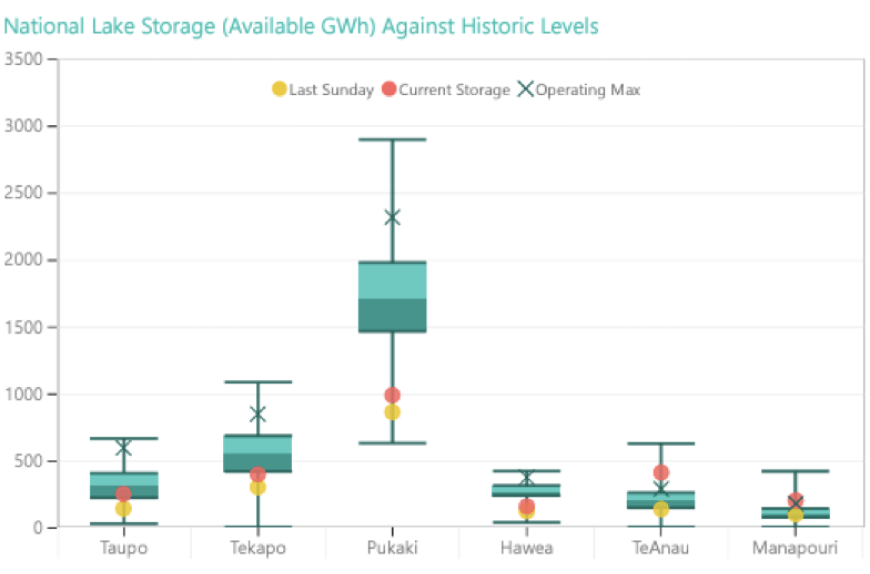
These low inflows resulted in energy storage levels continuing to fall at the start of August reaching a minimum of 1,481GWh on the 22nd August, before the high inflows hit at the end of the month raising storage to 1,914 (42% full) at the end of the month – an increase of 209GWh over the month. The following chart shows the latest breakdown of storage across the main hydro catchments.
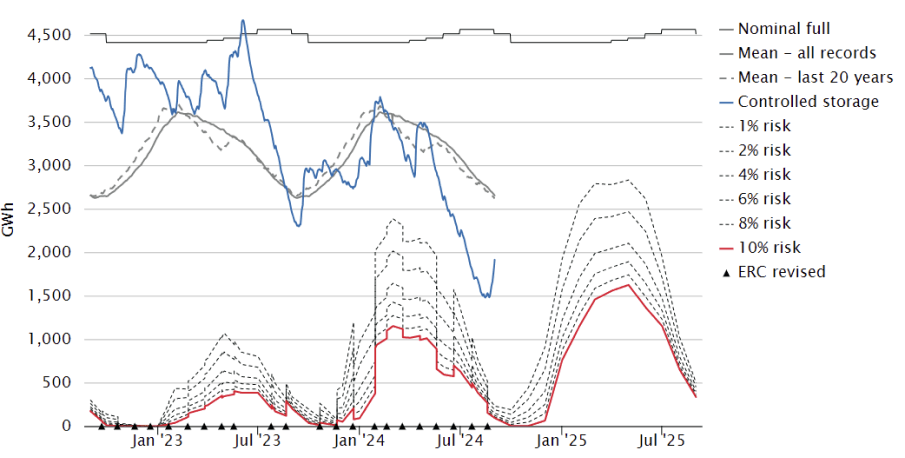
Security of supply risks decreased at the end of August with storage levels increasing. This is shown in the following risk curves.
Snowpack
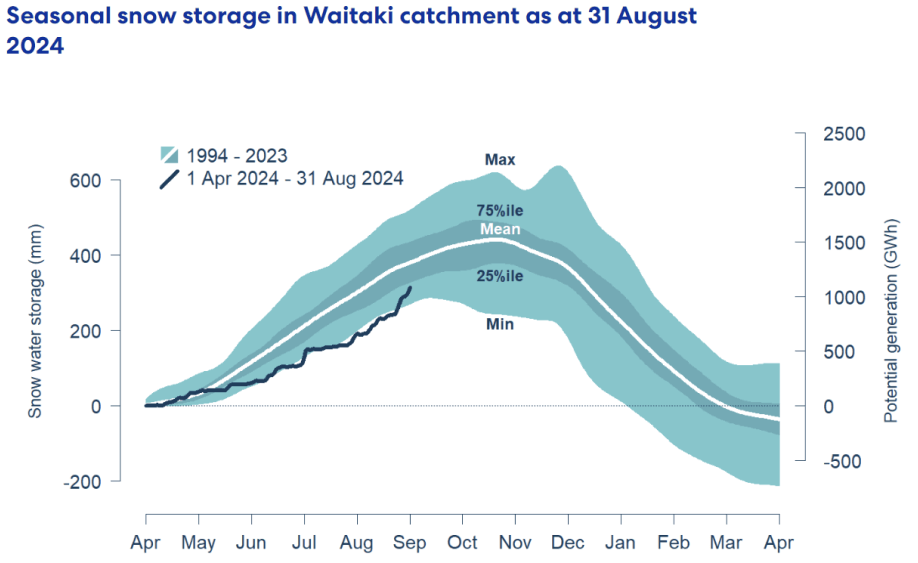
Snowpack is an important way that hydro energy is stored over the winter months and released as hydro inflows in the spring. The following graph shows that the snowpack in the important Waitaki catchment increased through August and is now close to the 25th percentile levels seen in the last 30 years for this time of year.
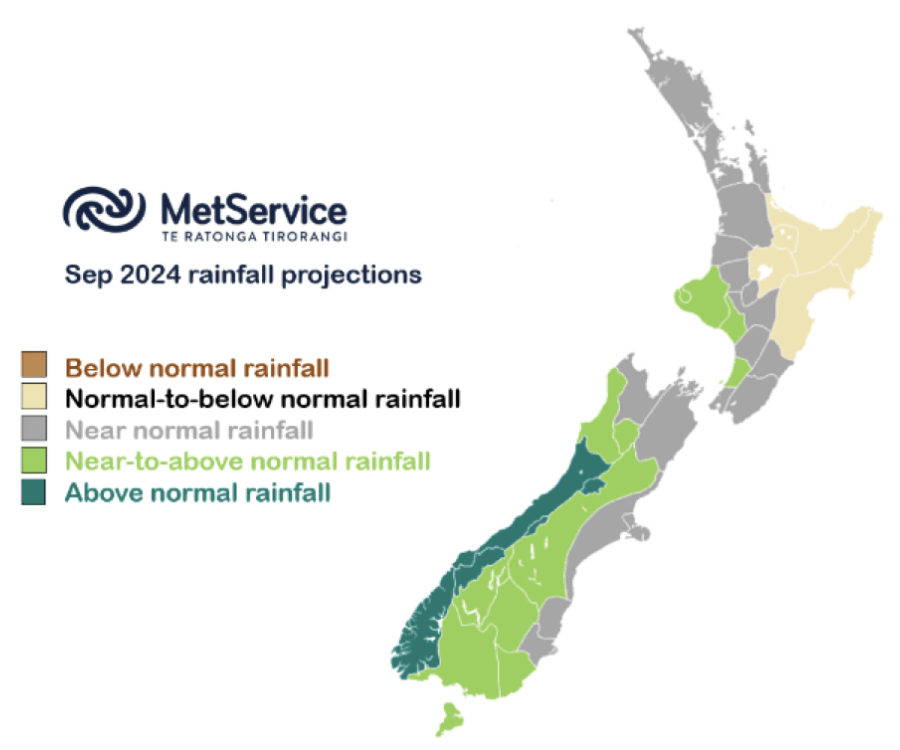
Climate outlook overview (from the MetService)
Climate drivers — El Niño Southern Oscillation (ENSO) remains neutral, and should remain this way through September, with the most influential climate drivers originating closer to New Zealand. Longer-range models are picking a near-even chance of a weak La Niña developing in the October-December time frame.
The negative Southern Annular Mode (SAM), which directed an enhanced westerly flow across the South Island over the last few weeks, is expected to remain negative over the coming fortnight, though a weakening trend is likely during the second week of September with the frequency of westerly systems dropping slightly. The Tasman Sea Index (TSI) is picked to trend slightly positive by the middle of next week, with the North Island seeing a slight respite in the active weather seen recently as high pressure moves ashore.
The second half of September is likely to show near-normal SAM and positive TSI, with hints of a drier North Island under slow-moving high pressure, while the odd front slips over the South Island to bring near-average conditions.
September 2024 Outlook — An active westerly flow brings frequent bursts of rain to western regions over the coming days, with Westland and Fiordland seeing the highest accumulation. Expect strong but warm westerly winds to extend across eastern New Zealand in advance of these systems. The flow tips towards a cooler southwesterly later next week, with temperatures falling slightly below normal across the South Island by the weekend. Model data supports a risk of widespread frosts and snowfalls from later next week in the south, particularly for inland Canterbury and Otago.
Little change during the second week of September, with a generally chilly outlook persisting across the country. Marginally wetter-than-normal conditions are expected for western South Island, along with an elevated risk for quick-moving snow events. Cooler than average for the North Island with near-average rainfall, with the one exception being in the southwest which could see an uptick in showers.
The southwesterly flow likely eases towards mid-month as a high pressure anomaly develops and becomes slow-moving east of the country. Chilly mornings but warming afternoons will be the norm as ridges shift across New Zealand, while a gradual return to westerlies are possible, particularly across the South Island. A front or two is likely to bring brief bursts of rain in the south each week, with diminishing returns further north. Soil moisture content is near saturation country-wide, but this is likely to decrease during the final weeks of September, with longer spells of fine weather becoming more likely.
The Wholesale Gas Market
Spot gas prices in August increased even further from the already very high levels seen in July peaking at more than $50/GJ on daily trades before crashing at the end of the month due to reduced demand for gas for electricity generation. Prices for the month averaged $39/GJ – an 11% increase compared to July. Average prices remain more than 250% higher than they were at the same time last year.
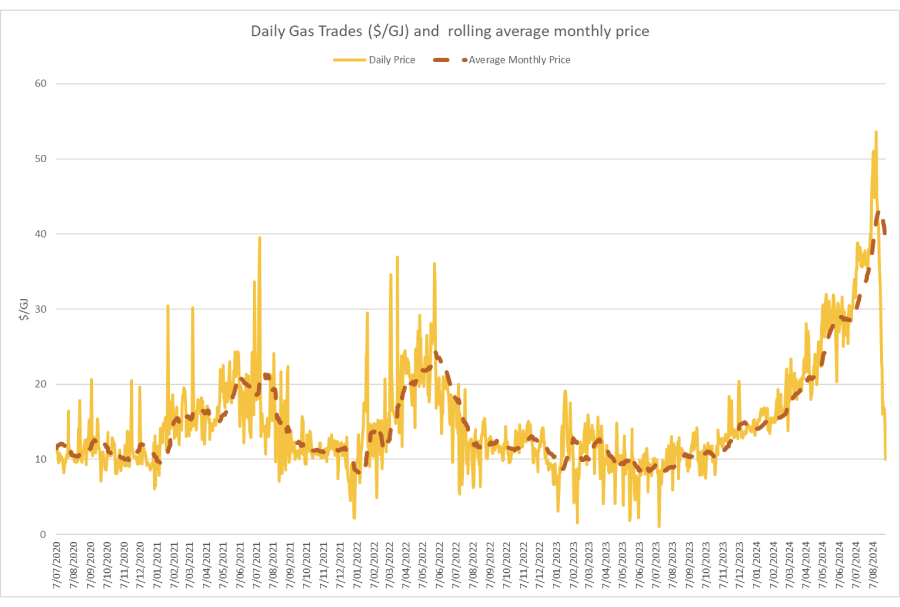
Some gas retailers are refusing to offer contracts to end users even where they are the incumbent retailer. Some tenders are getting no offers at all from retailers. Nothing of any substance has come from the Government appointed Gas Security Response Group tasked to look at how to improve the gas supply situation.
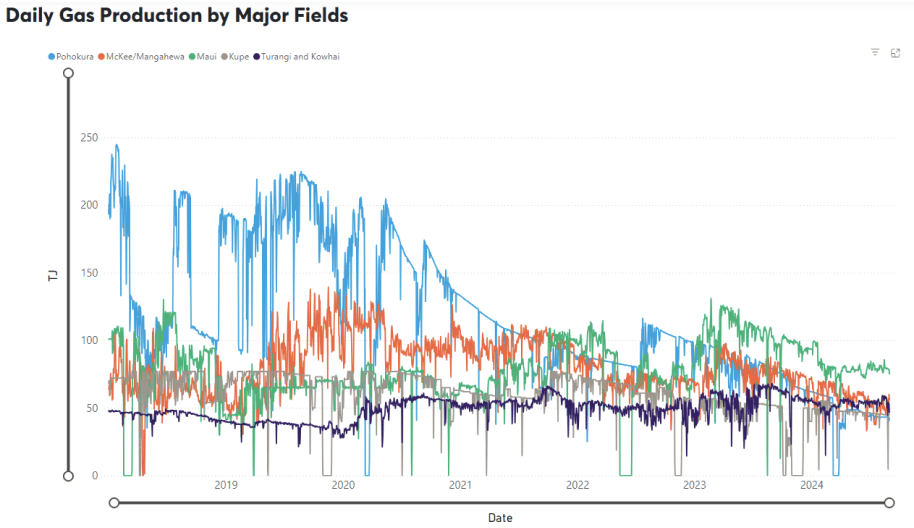
On the supply side, most fields again managed to maintain output levels from last month. Maui produced 79TJ/day – down 1%. Pohokura maintained output at around 43TJ/day. McKee / Mangahewa produced 51TJ/day – up 2%. Kupe maintained around 45TJ/day apart from a short outage at the end of the month.
The following graph shows production levels from major fields over the last 6 years.
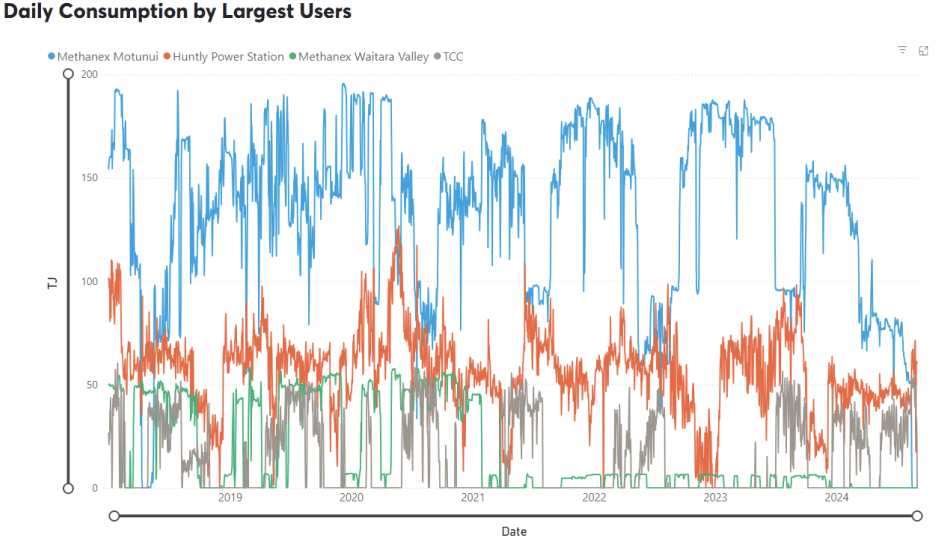
The demand side was where all the action was in August. Methanex did a deal with the large electricity generators to shut down its Motunui site in the middle of August through to the end of October. Gas usage had already reduced to 50TJ/day but dropped to zero on the 15th August. At the same time Huntly usage increased from 42TJ/day to over 60TJ/day, and TCC increased usage from 35TJ/day to more than 50TJ/day.
The following graph shows trends in the major gas users over the last 6 years.
Internationally, LNG netback prices ended the month up at $16.28/GJ – up 4% from last month. Forecast prices for 2024 increased to $15.31 – up 2% compared to July. Forecast prices for 2025 were up 4% at $17.98/GJ. (Note that netback prices are indicative of international prices – they are produced by the ACCC and quoted in Australian dollars. They are net of the estimated costs to convert from pipeline gas in Australia to LNG, hence the term “netback”).
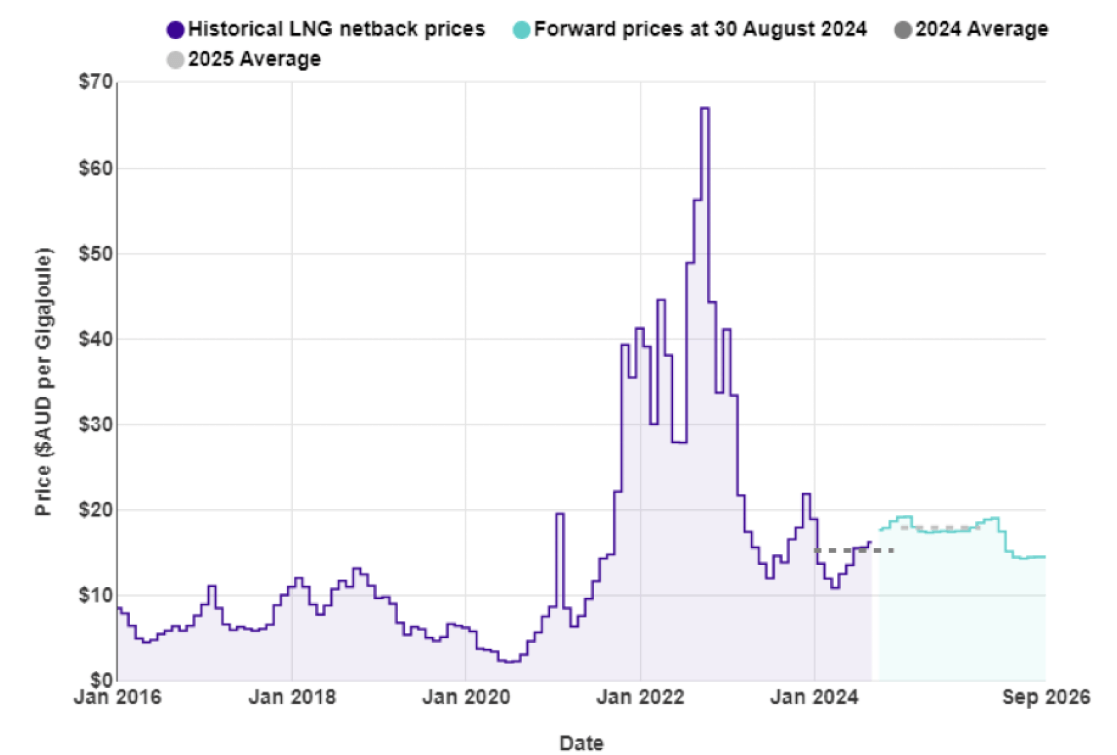
New Zealand does not (yet) have an LNG export/import market, so our domestic prices are not directly linked to global prices. With recent gas supply issues, the Government is now talking about the possibility of building an LNG import facility.
LPG is an important fuel for many large energy users, particularly in areas where reticulated natural gas is not available. The contract price of LPG is typically set by international benchmarks such as the Saudi Aramco LPG – normally quoted in US$ per metric tonne.
The following graph shows the Saudi Aramco LPG pricing for the last 3 years as well as forecast pricing for the year ahead. There has been an increase in futures pricing over the last month.
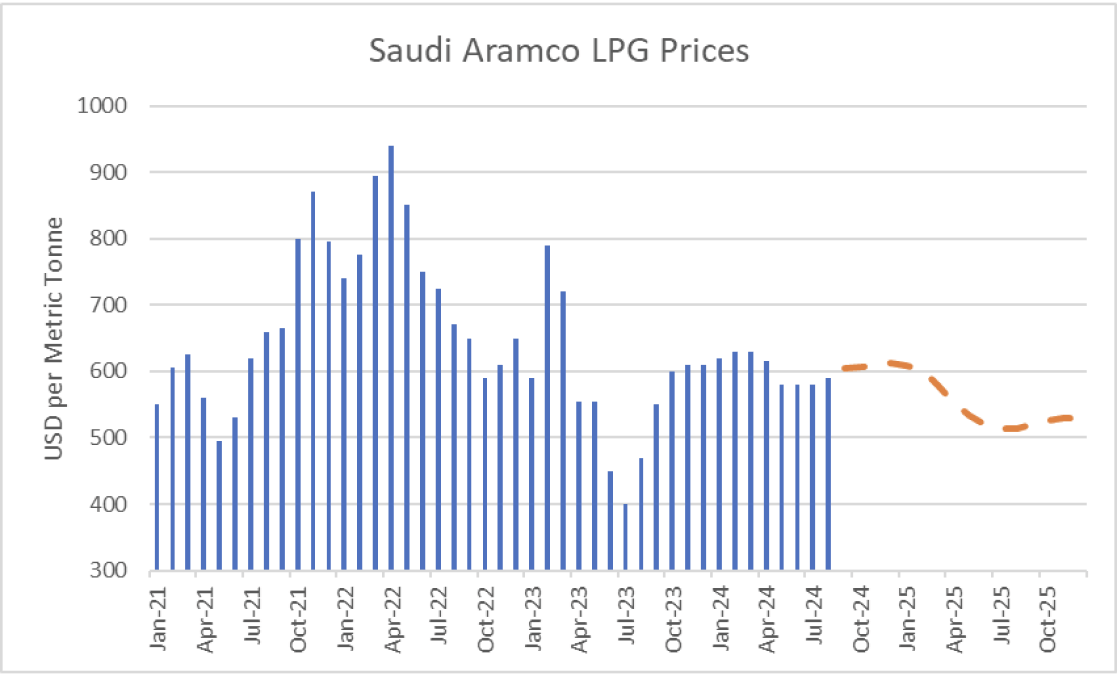
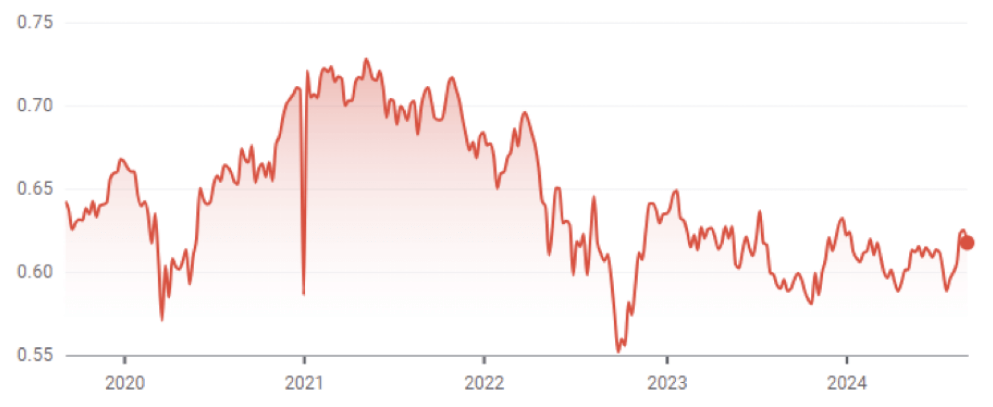
The other main contributing factor to LPG prices in New Zealand is the exchange rate against the USD. There has been a significant increase in the last month which will put downward pressure on NZ LPG pricing.
The Coal Market
The global energy crisis has been as much about coal as it has gas. The war in the Ukraine has driven energy prices, including coal, up. Prices in August were largely flat, ending the month at US$143/T – a 2% decrease on the July close. These prices are finally returning to levels close to what we expect to see as shown in the following graph of prices over the last 10 years.
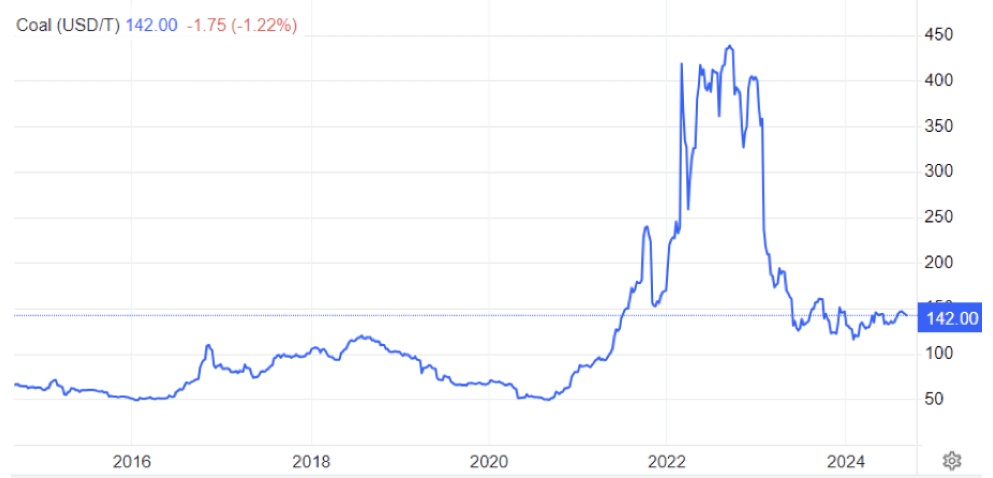
Like gas, the price of coal can flow through and have an impact on the electricity market. Last month Genesis reported that it had imported additional coal. Stockpiles had reduced to 231,000 tonnes at the end of June – down from 624,000 tonnes at the end of March. Genesis says that it usually aims to hold about 350,000 tonnes of coal.
Carbon Pricing
NZ has had an Emissions Trading Scheme (ETS) in place since 2008. It has been subsequently reviewed by several governments and is now an “uncapped” price scheme closely linked to international schemes. However, there are “upper and lower guard-rails” set up to prevent wild swings in carbon price that act as minimum and maximum prices. These increased in December 2023 to $173 and $64 respectively. Carbon prices increased 15% in August to $61.3 on the back of the government announcing plans to overhaul the national trading system.
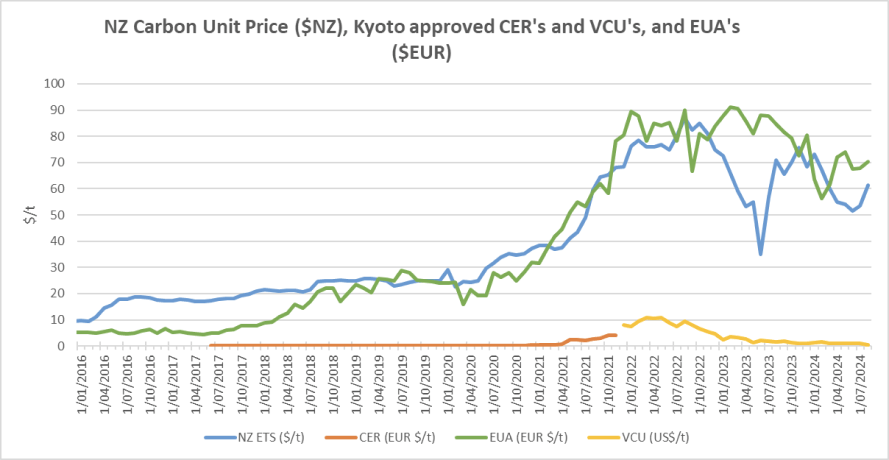
As the carbon price rises, the cost of coal, gas or other fossil fuels used in process heat applications will naturally also rise. Electricity prices are also affected by a rising carbon price. Electricity prices are set by the marginal producing unit – in NZ this is currently typically coal or gas or hydro generators, with the latter valuing the cost of its water against the former. An increase in carbon price can lead to an increase in electricity prices in the short to medium term (as the marginal units set the price). A carbon price of $50/t is estimated to currently add about $25/MWh (or ~2.5c/kWh) to electricity prices. In the long term the impact should reduce as money is invested in more low-cost renewables and there is less reliance on gas and coal fired generation.
EU Carbon Permits increased in August to 70 Euro/tonne – up 4%.
About this Report
This energy market summary report provides information on wholesale price trends within the NZ Electricity Market.
Please note that all electricity prices are presented as a $ per MWh price and all carbon prices as a $ per unit price.
All spot prices are published by the Electricity Authority. Futures contract prices are sourced from ASX.
Further information can be found at the locations noted below.
- Transpower publishes a range of detailed information which can be found here: https://www.transpower.co.nz/power-system-live-data
- The Electricity Authority publishes a range of detailed information which can be found here: https://www.emi.ea.govt.nz/
- Weather and Climate data – The MetService publishes a range of weather-related information which can be found here: https://www.metservice.com/
Disclaimer
This document has been prepared for information and explanatory purposes only and is not intended to be relied upon by any person. This document does not form part of any existing or future contract or agreement between us. We make no representation, assurance, or guarantee as to the accuracy of the information provided. To the maximum extent permitted by law, none of Smart Power Ltd, its related companies, directors, employees or agents accepts any liability for any loss arising from the use of this document or its contents or otherwise arising out or, or in connection with it. You must not provide this document or any information contained in it to any third party without our prior consent.
About Smart Power
Smart Power is a full-service Energy Management consultancy. Apart from Energy Procurement, Smart Power can also provide:
- Technical Advice on how to reduce your energy use/emissions
- Sustainability Reporting
- Invoice Management services.
We also offer boutique energy and water billing service for landlords/property developers.
Contact us at https://smartpower1.wpenginepowered.com/contact/ or ring one of our offices to talk to one of our experienced staff about how we can assist you with achieving your energy goals.
© Copyright, 2024. Smart Power Ltd