
Market Update June 2024
The Wholesale Electricity Market
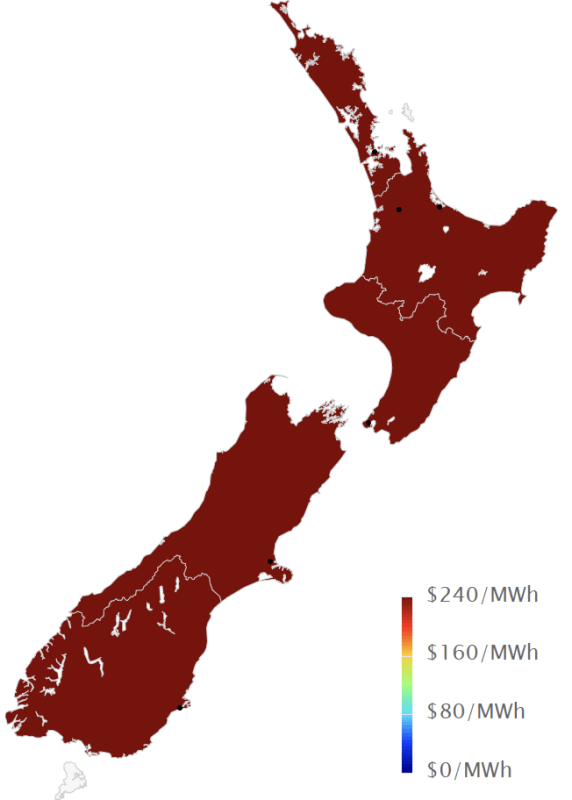
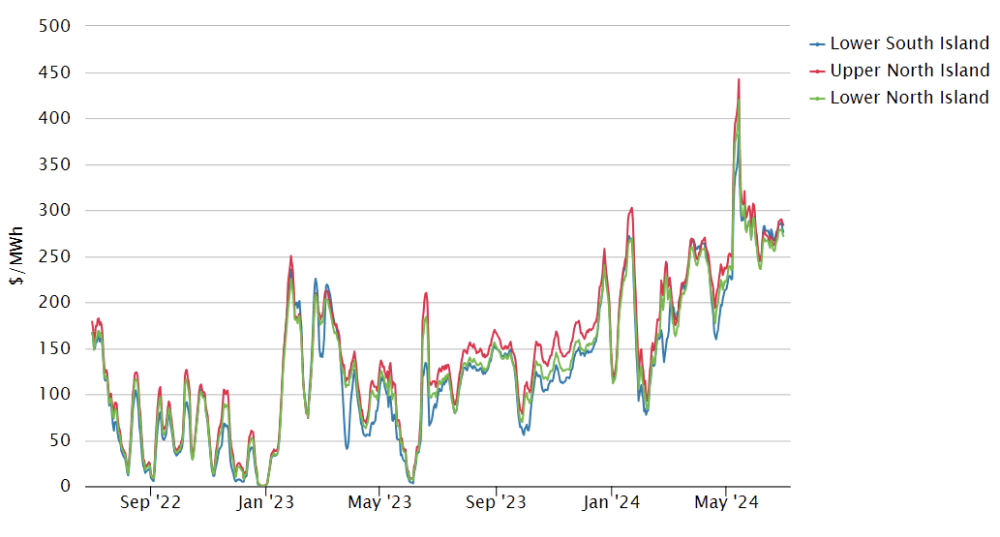
Spot prices in the wholesale electricity decreased in June but remained at very high levels. Average spot prices ranged from $248 in the central North Island (down from $301 in May), up to $286 in the upper South Island (down from $320).
The following chart shows average weekly spot prices over the last 2 years.
Electricity Demand
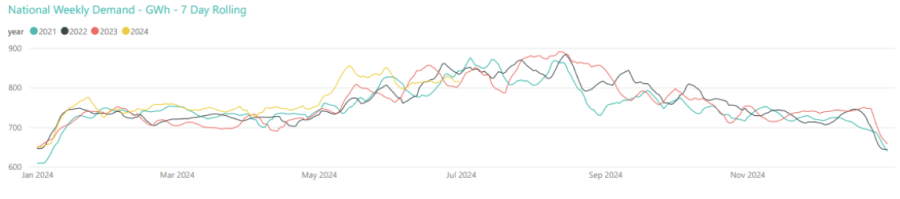
After several months of being higher than expected, electricity demand through June came back to the levels seen in winter months in recent years as shown below.
Electricity Generation Mix
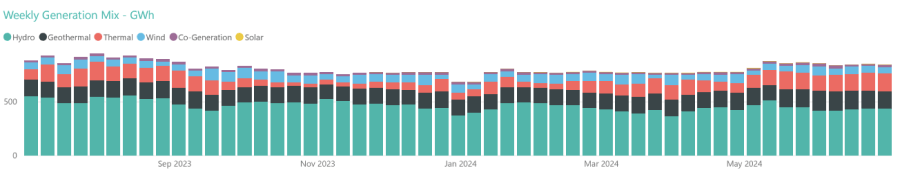
Through June the generation mix remained reasonably constant as shown below, with hydro being conserved as much as possible given the level of demand.
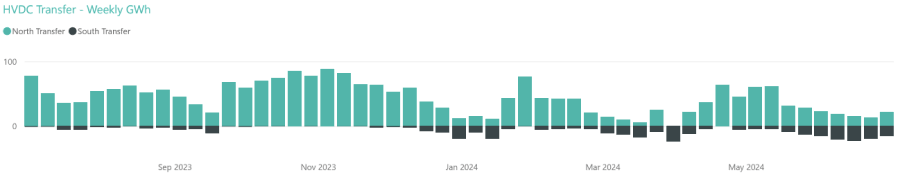
HVDC Transfer
Power transfers on the HVDC link connecting the North and South Islands are important both in showing relative hydro positions and the reliance on thermal power to meet demand. High northward flow tends to indicate a good SI hydro position, whereas the reverse indicates a heavy reliance on thermal power to make up for hydro shortages.
June saw further attempts to conserve South Island storage by reducing northward transfer and increasing southward transfer.
The Electricity Futures Market
The Futures Market provides an indication of where market participants see the spot market moving in the future. They are based on actual trades between participants looking to hedge their positions (as both buyers and sellers) into the future against potential spot market volatility. They are also a useful proxy for the direction of retail contracts.
The following graph shows Futures pricing for CY 2024, 2025, 2026 and 2027 at Otahuhu (Auckland) for the last 2 years.
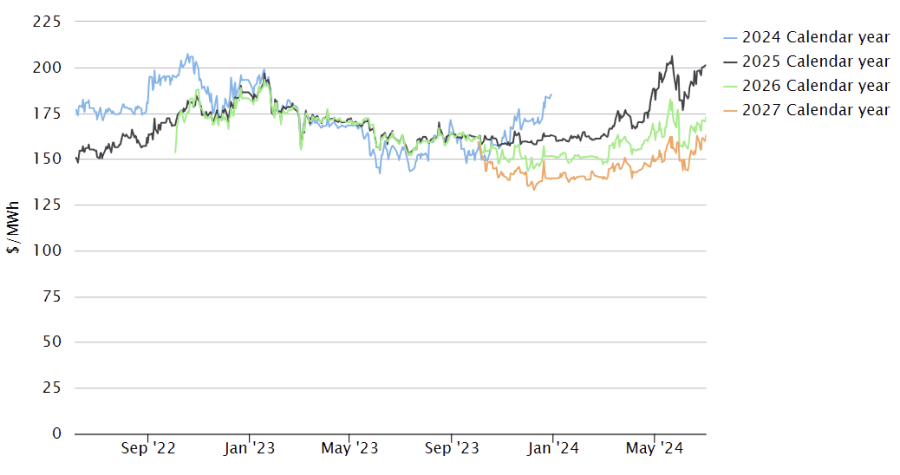
Note that $100/MWh equates to 10c/kWh.
Forward prices were up in June for all future years. CY 2025 ended the month up 10% at $200. CY 2026 price was up 9% at $171 while CY 2027 closed up 8% at $161/MWh.
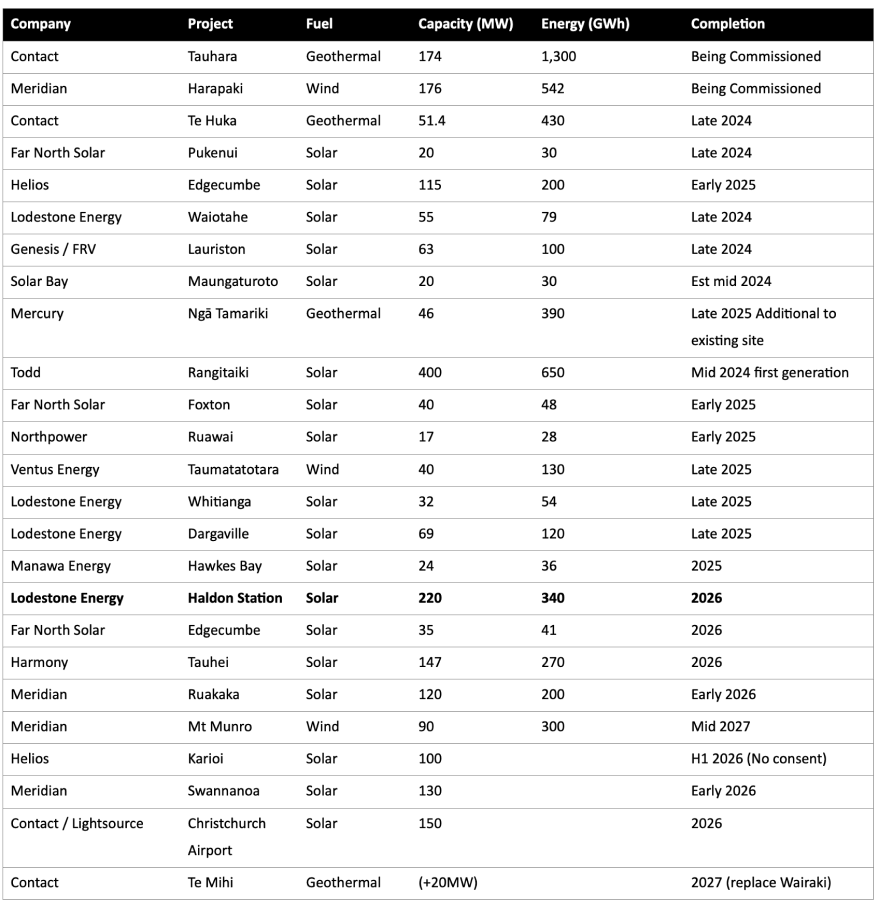
Known new generation projects are shown below (additions / removals / changes highlighted in bold).
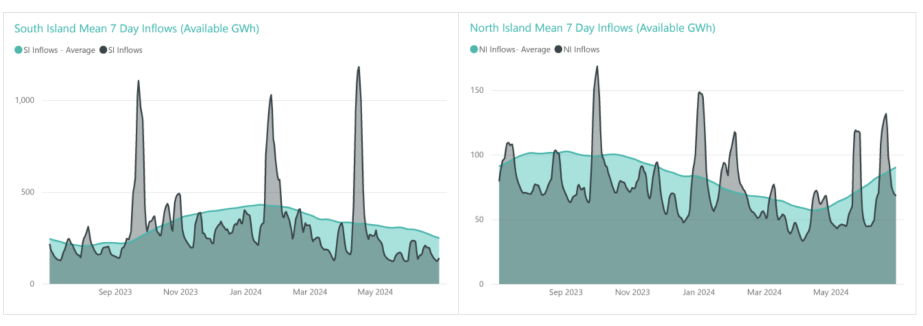
Hydro Storage
Inflows were very low again in the South Island during June. The North Island had below average inflows at the start of the month, however they picked up later to almost end up at average levels for the month.
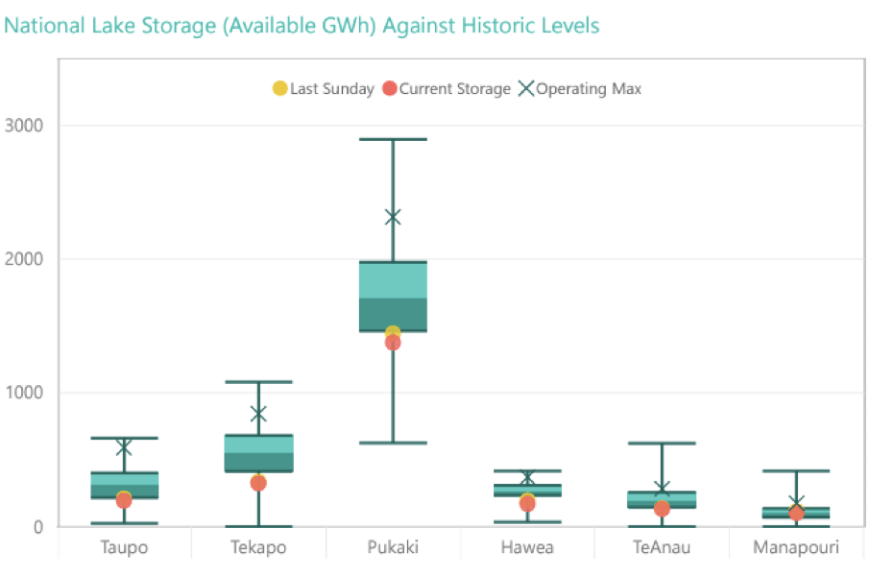
Very low inflows resulted in energy storage levels continuing to fall through June, though at a reduced rate compared to May. NZ storage ended the month at 2,182GWh or 48% full, down 419GWh. The following chart shows the latest breakdown of storage across the main hydro catchments.
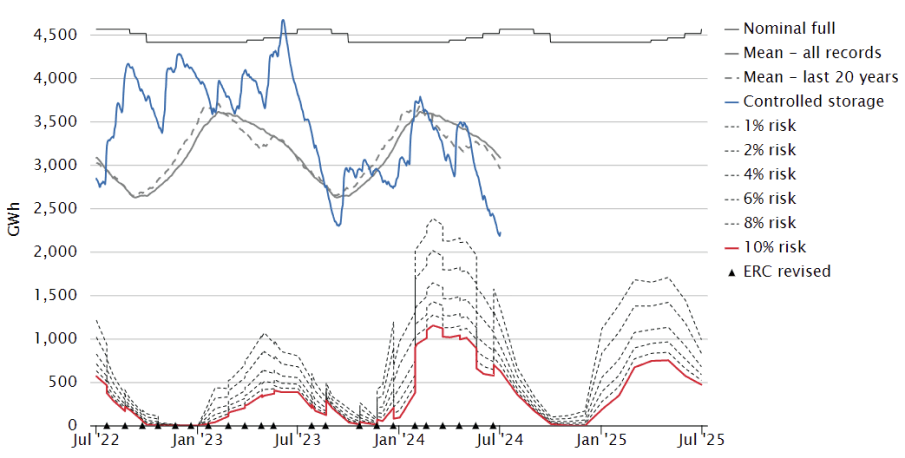
Security of supply risks increased further in June with storage levels decreasing. This is shown in the following risk curves.
Snowpack
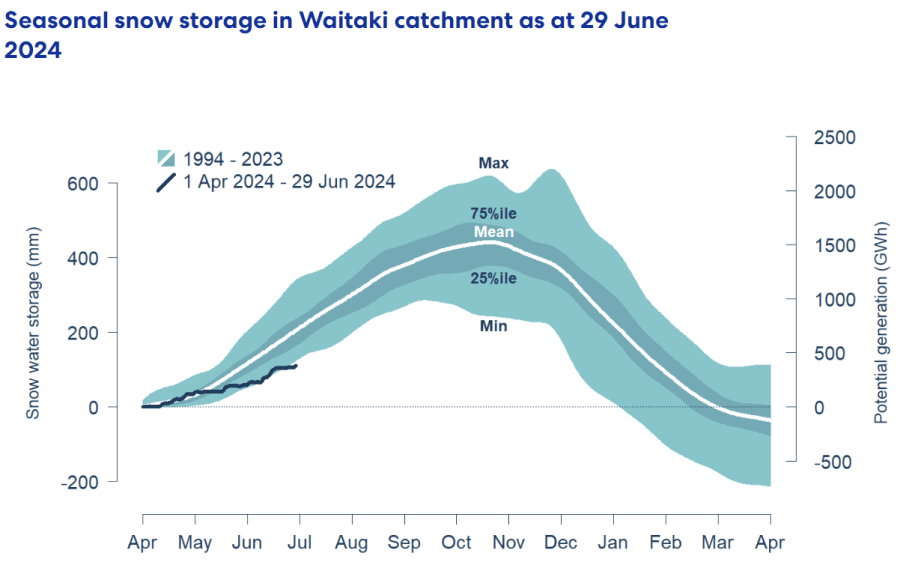
Snowpack is an important way that hydro energy is stored over the winter months and released as hydro inflows in the spring. The following graph shows that the snowpack in the important Waitaki catchment is currently close to the minimum levels seen in the last 30 years for this time of year.
Climate outlook overview (from the MetService)
Climate Drivers — June was a good reminder that winter can throw up all sorts of weather maps, especially when large scale climate drivers, like the El Niño Southern Oscillation (ENSO) are firmly in neutral territory. ENSO will remain neutral through the winter months and the most useful climate drivers to monitor over coming months will be those closer to home, including the Southern Annular Mode (SAM).
SAM is measure of how far north or south a belt of strong westerlies sits in the Southern Ocean. When strongly positive, the storms tend to run further south – through the Southern Ocean as high pressures are favoured around New Zealand. When SAM is strongly negative high pressure sits well to the south with lower-than-normal pressure around the Chatham Islands and enhanced westerlies across New Zealand. SAM is an important tool for medium range forecasting in New Zealand and you can find more information here; https://blog.metservice.com/Southern-Annular-Mode.
SAM has taken a bit of a nosedive over recent days, and this has helped inject cold air over NZ to start the month. Cool airmasses are likely to hang around with SAM remaining largely negative over the first week of the month, before a strong and prolonged positive phase is forecast through week two towards mid-month, hinting at a spell of settled and dry weather nationally. Expect SAM to be increasingly volatile later this month, with fast-moving weather patterns and changeable weather redeveloping.
Sea surface temperatures around and south of New Zealand remain just below average overall, despite a slight warming since May. There remains a heightened chance of La Niña developing this spring, with flow on effects possible as we approach the summer months.
July 2024 Outlook — uly started off with a very mobile Southern Ocean low (thank you negative SAM) crossing the country and a burst of heavy rain for all, followed by cold south-westerly showers. The lower South Island also saw snow to low levels as cold air flooded in. Despite the mild June, this event has really helped kick ski resorts into gear with many of the South Island ski fields seeing 30-60cm of fresh snow as this system moved through and now looking in fantastic shape for the start of the school holidays next week.
Cold and sometimes brisk southerly quarter winds remain on the cards for most of the country into early next week, beginning Monday 8th, as high pressure near Tasmania extends a dominant ridge north-eastward across the Tasman Sea. Whilst we might see the odd shower at times in this flow, there will be plenty of fine, dry, sunny afternoons and crisp, frosty mornings, but watch out for sharp winds in exposed windward and mountainous areas. As we move into the start of calving season, farmers should keep one eye on those minimum temperatures, with some of the coldest weather we have seen this year likely by the end of this week and widespread rural frosts forecast.
This high-pressure cell will become centred over New Zealand itself early next week, then only gradually drift eastward towards mid-month. These cold, winter highs can often be quite slow to move away and should offer up a prolonged spell of dry, settled weather nationwide. However, different weather hazards can present themselves in these set-ups including widespread frosts, icy roads, cold daytime temperatures, thick valley fogs and persistent low cloud. Despite the lack of forecast rain, it will pay to check in with your latest forecast at metservice.com.
As we head towards mid-month, weather models gradually move this high pressure away from our shores, with a weather system brewing in the Tasman Sea and a return of milder N-NW winds across the country. Expect a more unsettled window to develop as this Tasman system moves in, with northern and western facing portions of NZ most at risk of seeing heavy rain as it moves in. This feature might bring a few days of inclement weather, but don’t expect it to stall for weeks on end to the west of the country like we saw in June. Indeed, through the second half of July, expect the weather maps to change regularly as low pressure systems and fronts move through much more quickly than last month. Expect temperatures to bounce around through the second half of July too, with some very mild spells followed by sharp cold snaps.
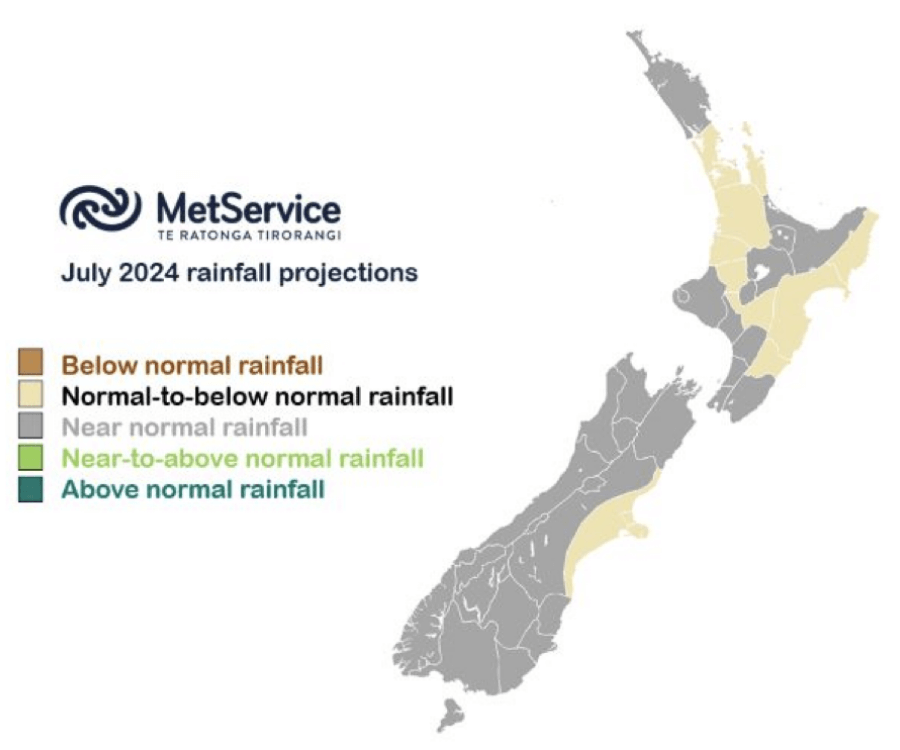
So, despite a cold and dry opening salvo this July, a much more unsettled outlook from mid-month means overall we may end up fairly close to July averages for monthly rainfall and temperatures right across the country, albeit with some drier anomalies favoured for Canterbury and central parts of North Island.
The Wholesale Gas Market
Spot gas prices remained at the very high levels seen in May, averaging $28.6/GJ for June. Wholesale prices are 227% higher than they were at the same time last year.
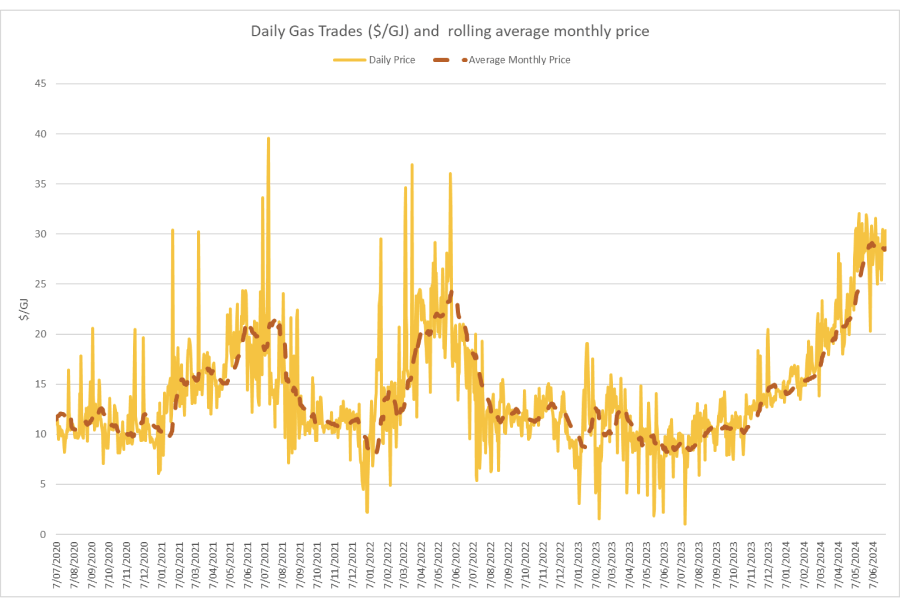
We have seen signs that gas retailers are refusing to offer contracts to end users even where they are the incumbent retailer. Some tenders are getting no offers at all from retailers.
The Government has set up a body, the Gas Security Response Group, to “coordinate a response to reports of an increasingly tight gas supply from the GIC and the broader gas sector. It will verify gas supply and demand and identify actions to address the situation.” It will be interesting to see what they come up with, however it is difficult to see what they can do in the short term apart from reducing supply to some large gas users to free up supply for others.
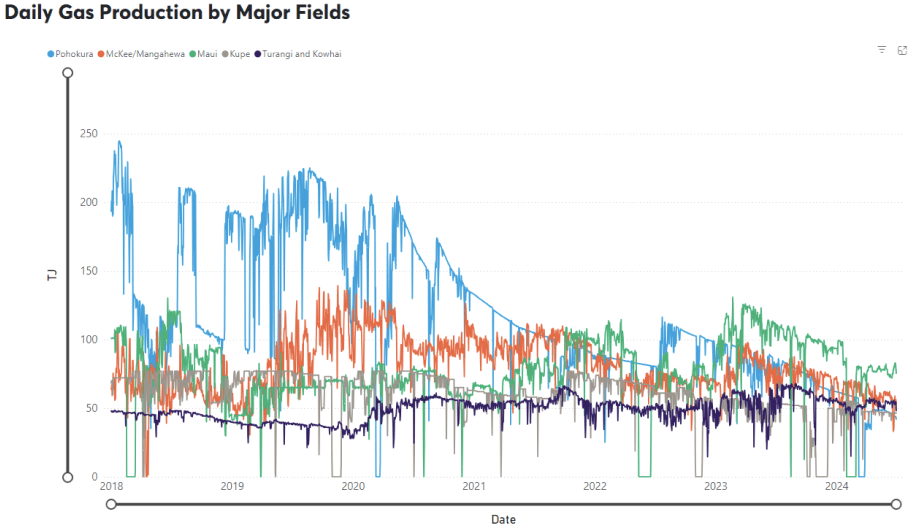
On the supply side all fields showed a continuation of a gradual decline in production from already low levels. Pohokura started the month producing around 48TJ/day, reducing to 42TJ by the end of the month. Maui averaged around 76.5TJ/day – down 2.5%. McKee / Mangahewa averaged 55TJ per day, down from 60 in May. Kupe also dropped slightly from 47TJ per day down to 46.5.
The following graph shows production levels from major fields over the last 6 years.
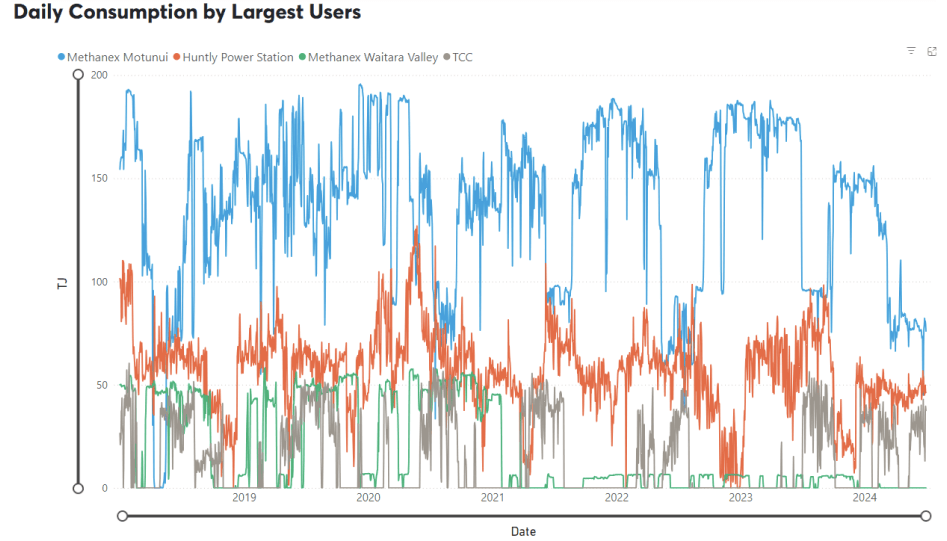
On the demand side, Methanex Motonui’s usage remained at the lower levels experienced in recent months providing the buffer for the reduced supply. Usage averaged close to 75TJ/day through June – down from 80TJ/day in May. Huntly power station increased marginally, averaging 48TJ/day, while TCC ran all month, averaging close to 30TJ per day.
The following graph shows trends in the major gas users over the last 6 years.
Internationally, LNG netback prices ended the month at $15.56/GJ – up 14% from last month. Forecast prices for 2024 increased to $14.95 – up 1% compared to May. Forecast prices for 2025 were also up marginally at $16.57/GJ.
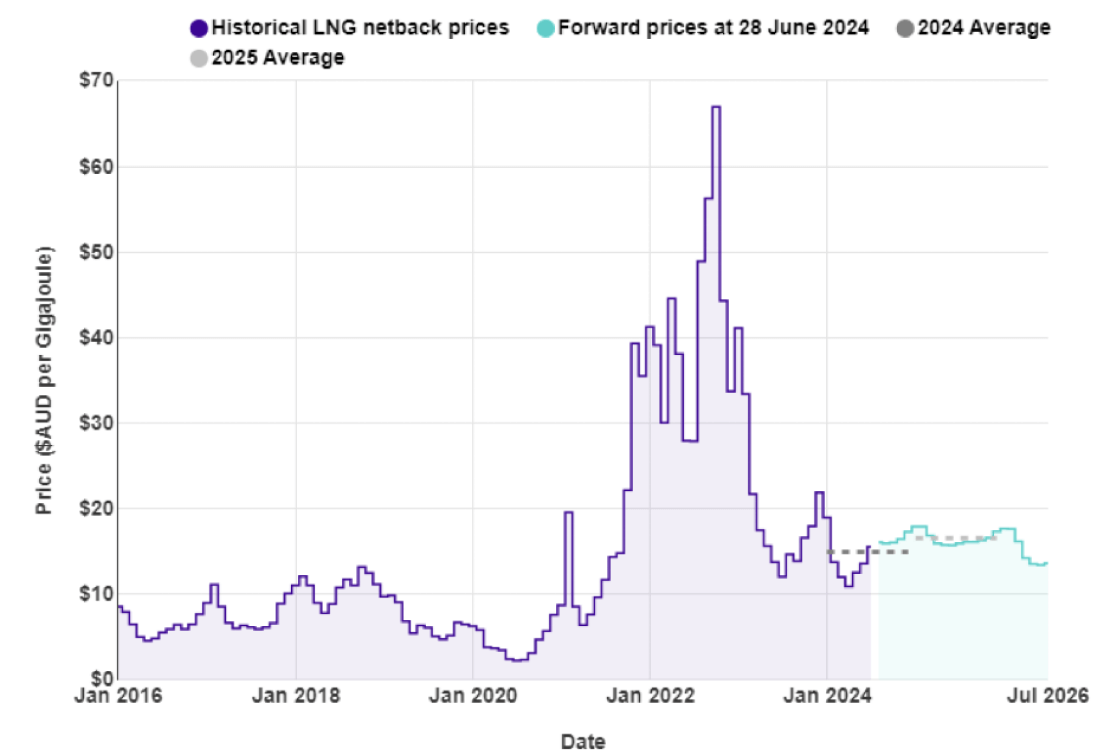
New Zealand does not have an LNG export market, so our domestic prices are not directly linked to global prices.
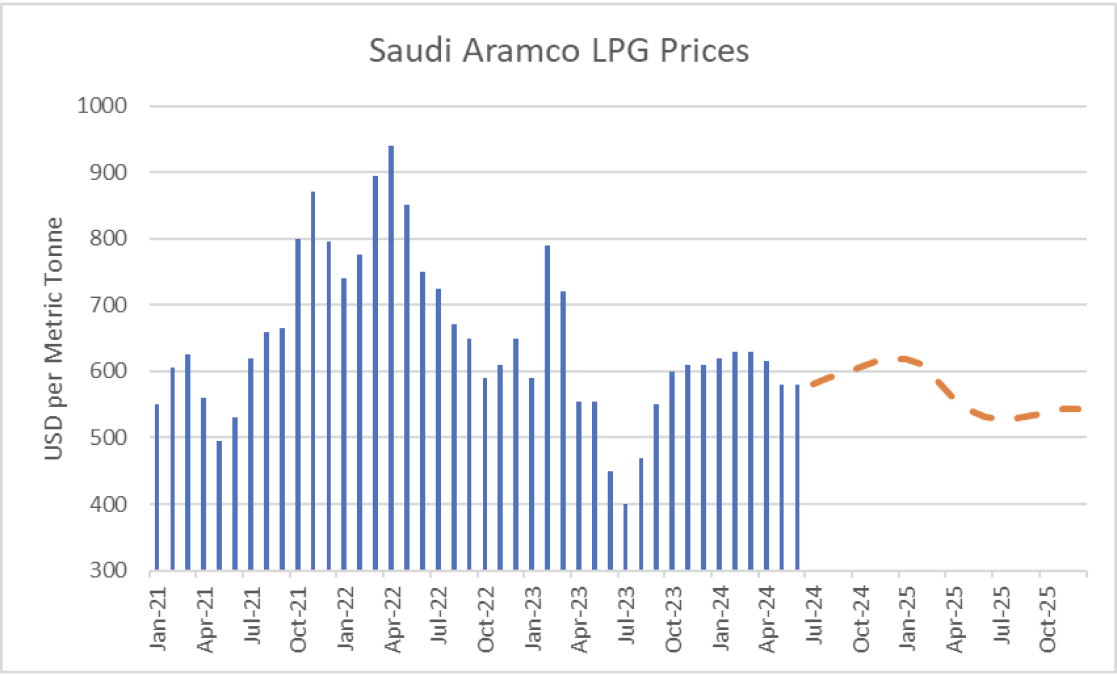
LPG is an important fuel for many large energy users, particularly in areas where reticulated natural gas is not available. The contract price of LPG is typically set by international benchmarks such as the Saudi Aramco LPG – normally quoted in US$ per metric tonne.
The following graph shows the Saudi Aramco LPG pricing for the last 3 years as well as forecast pricing for the year ahead. There has been a significant increase in futures pricing over the last month.
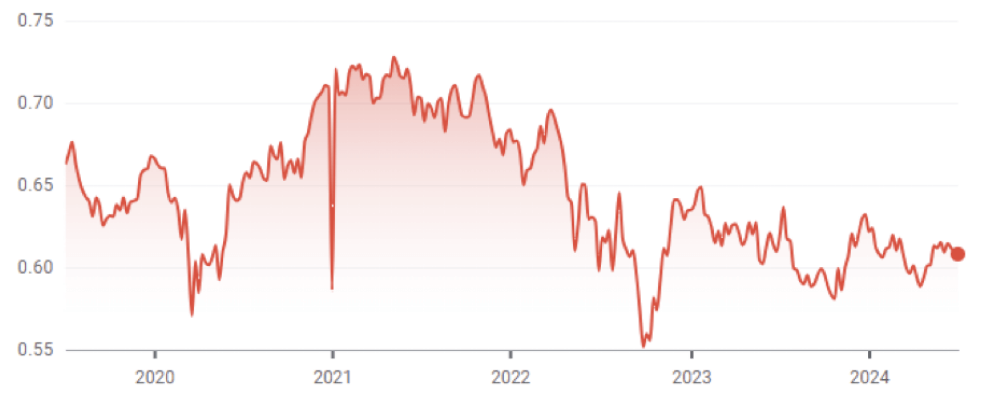
The other main contributing factor to LPG prices in New Zealand is the exchange rate against the USD. As shown below this has been falling over the last few years adding to domestic LPG prices.
The Coal Market
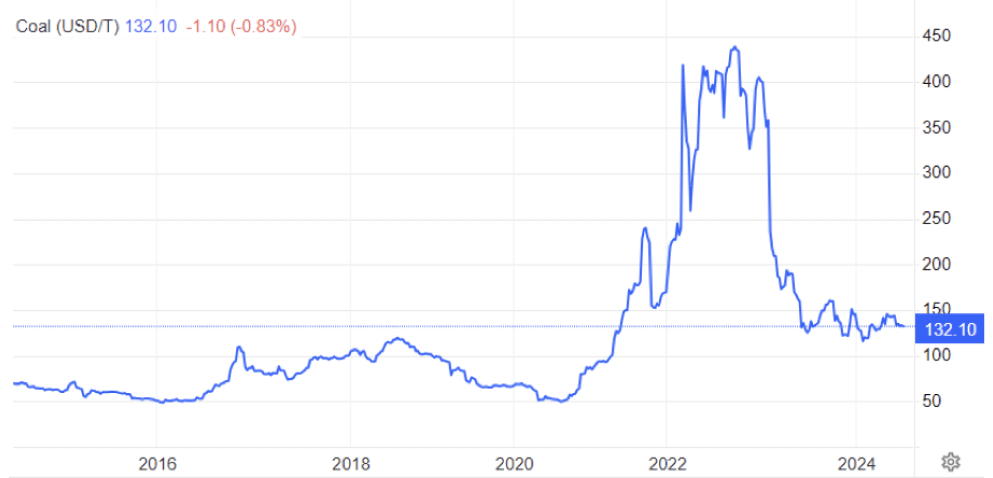
The global energy crisis has been as much about coal as it has gas. The war in the Ukraine has driven energy prices, including coal, up. Prices in June were down, ending the month at US$132/T – an 8% decrease on the May close. These prices are finally returning to levels close to what we expect to see as shown in the following graph of prices over the last 10 years.
Like gas, the price of coal can flow through and have an impact on the electricity market. In April, Genesis reported that coal stockpiles had been reducing over the last couple of years. The Huntly coal stockpile held 624,000 tonnes as at 31 March 2024, down from 731,000 tonnes at 31 December 2023, 859,000 tonnes at 30 September 2023, and 968,000 tonnes a year earlier.
Carbon Pricing
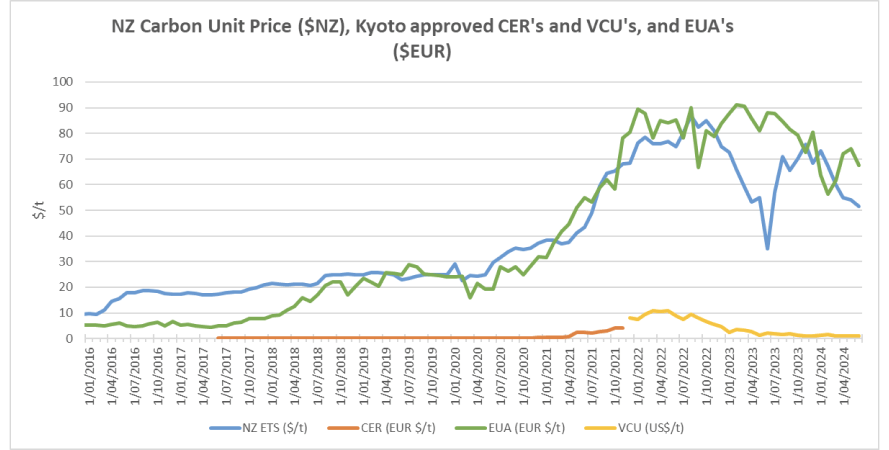
NZ has had an Emissions Trading Scheme (ETS) in place since 2008. It has been subsequently reviewed by several governments and is now an “uncapped” price scheme closely linked to international schemes. However, there are “upper and lower guard-rails” set up to prevent wild swings in carbon price that act as minimum and maximum prices. These increased in December 2023 to $173 and $64 respectively. Carbon prices decreased a further 4% in June to $51.6.
As the carbon price rises, the cost of coal, gas or other fossil fuels used in process heat applications will naturally also rise. Electricity prices are also affected by a rising carbon price. Electricity prices are set by the marginal producing unit – in NZ this is currently typically coal or gas or hydro generators, with the latter valuing the cost of its water against the former. An increase in carbon price can lead to an increase in electricity prices in the short to medium term (as the marginal units set the price). A carbon price of $50/t is estimated to currently add about $25/MWh (or ~2.5c/kWh) to electricity prices. In the long term the impact should reduce as money is invested in more low-cost renewables and there is less reliance on gas and coal fired generation.
EU Carbon Permits decreased in June to 67.5 Euro/tonne – down 9%.
About this Report
This energy market summary report provides information on wholesale price trends within the NZ Electricity Market.
Please note that all electricity prices are presented as a $ per MWh price and all carbon prices as a $ per unit price.
All spot prices are published by the Electricity Authority. Futures contract prices are sourced from ASX.
Further information can be found at the locations noted below.
- Transpower publishes a range of detailed information which can be found here: https://www.transpower.co.nz/power-system-live-data
- The Electricity Authority publishes a range of detailed information which can be found here: https://www.emi.ea.govt.nz/
- Weather and Climate data – The MetService publishes a range of weather-related information which can be found here: https://www.metservice.com/
Disclaimer
This document has been prepared for information and explanatory purposes only and is not intended to be relied upon by any person. This document does not form part of any existing or future contract or agreement between us. We make no representation, assurance, or guarantee as to the accuracy of the information provided. To the maximum extent permitted by law, none of Smart Power Ltd, its related companies, directors, employees or agents accepts any liability for any loss arising from the use of this document or its contents or otherwise arising out or, or in connection with it. You must not provide this document or any information contained in it to any third party without our prior consent.
About Smart Power
Smart Power is a full-service Energy Management consultancy. Apart from Energy Procurement, Smart Power can also provide:
- Technical Advice on how to reduce your energy use/emissions
- Sustainability Reporting
- Invoice Management services.
We also offer boutique energy and water billing service for landlords/property developers.
Contact us at https://smartpower1.wpenginepowered.com/contact/ or ring one of our offices to talk to one of our experienced staff about how we can assist you with achieving your energy goals.
© Copyright, 2024. Smart Power Ltd